Improving comparison shopping on Amazon.com
Reducing the friction of purchasing electronic products

Background
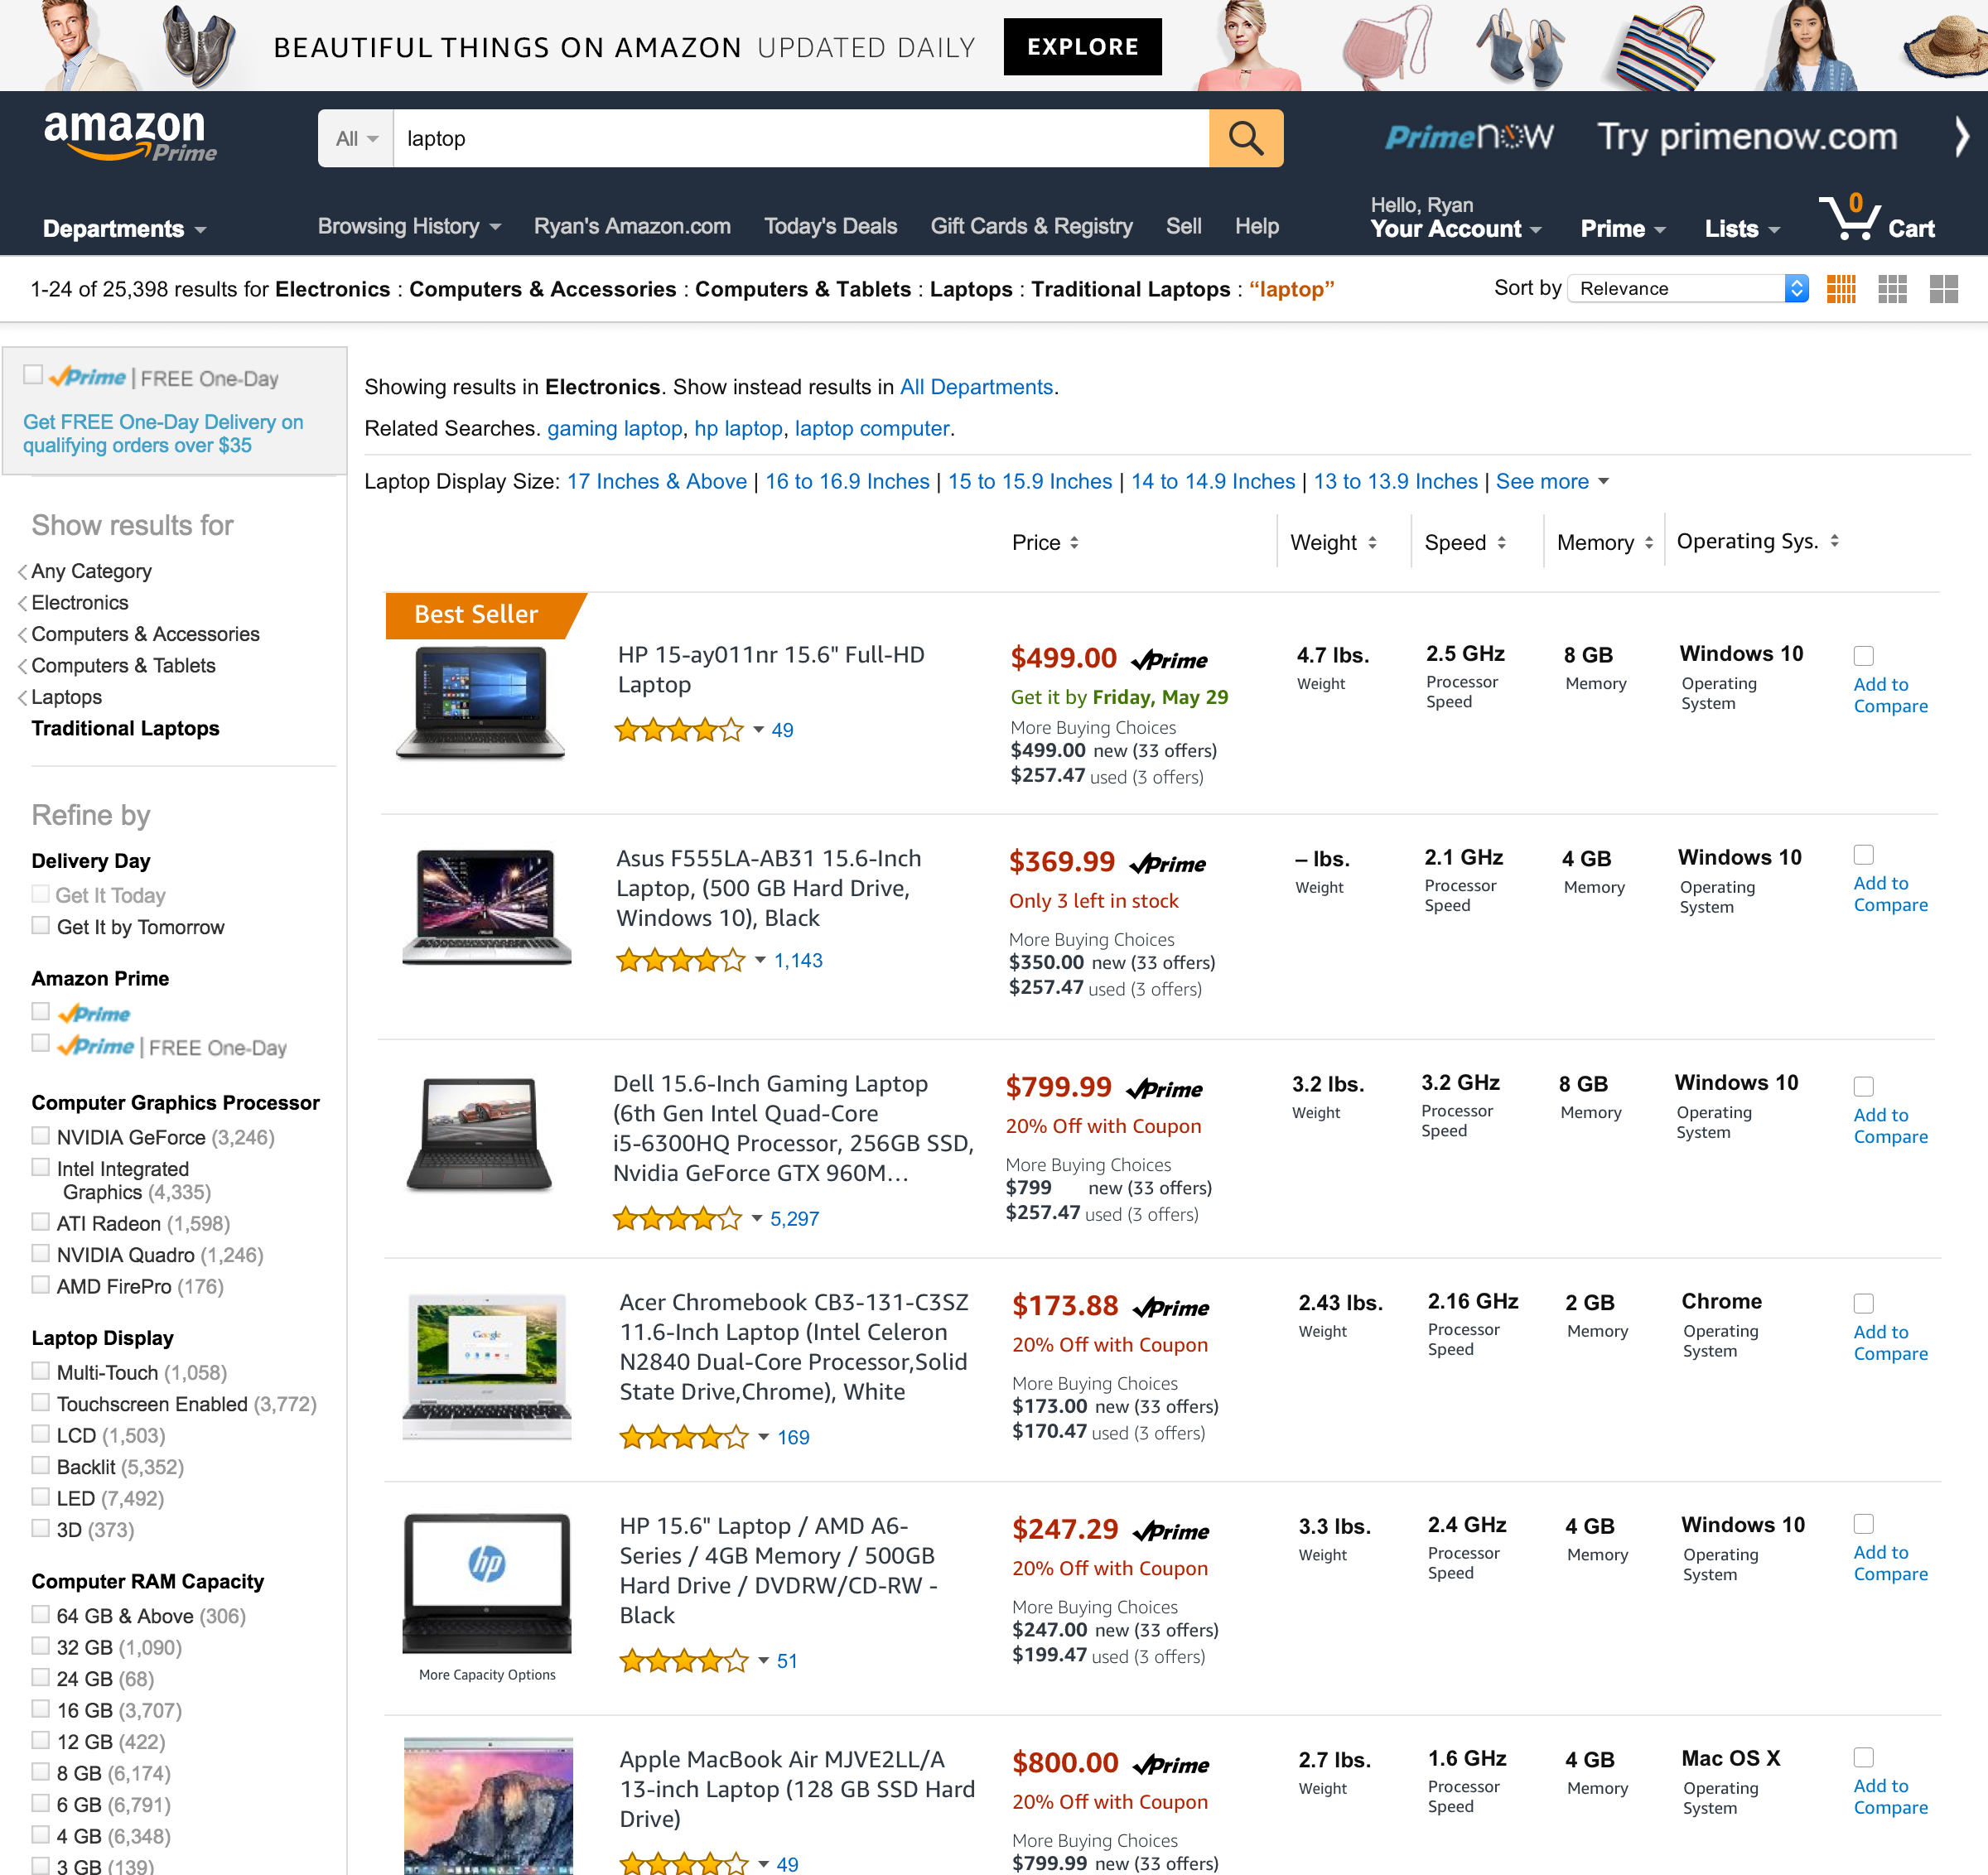
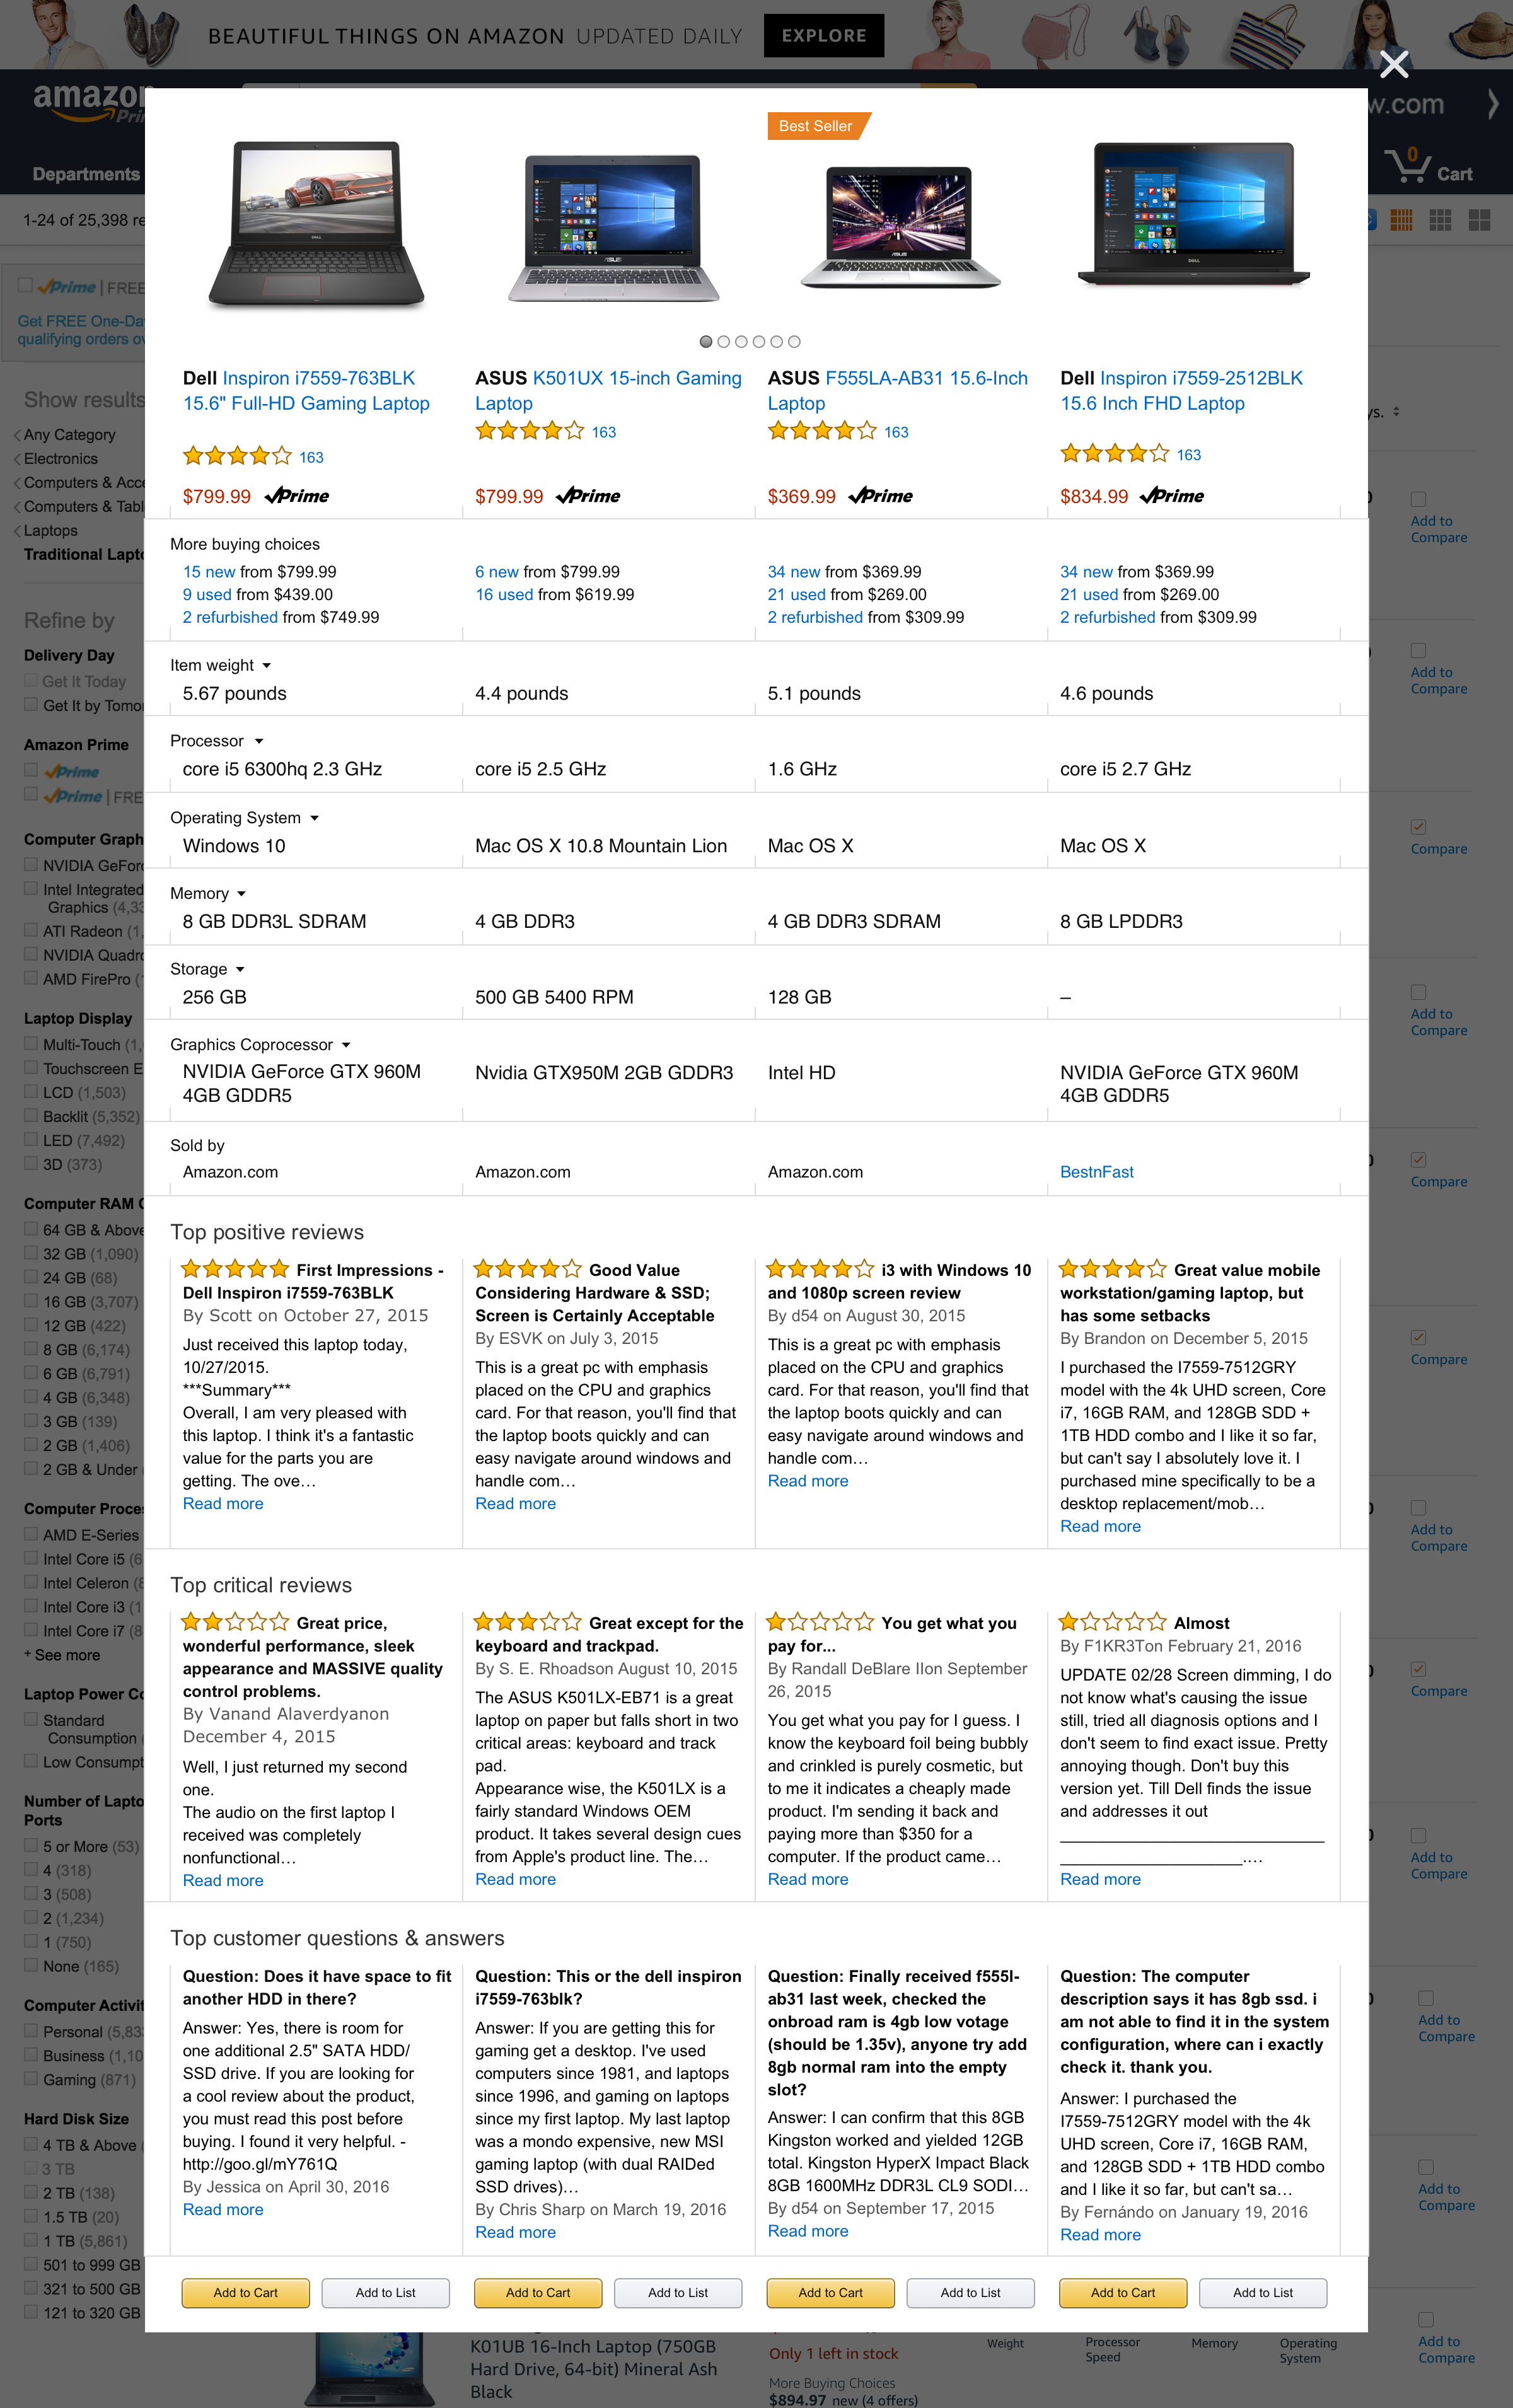
Researchers identified a common behavior of opening multiple tabs in a browser when comparing one kind of product with another. It was not distinct to just amazon.com but to most ecommerce sites and experiences.
We asked ourselves, how might we reduce the friction in the consideration phase of the purchasing journey?
- Role
- UX Design
- Contribution
- Prototyping
- UI design
- Collaborators
- Product Manager
- Design Technologist
- UX Designers
Problem statement
Amazon.com customers were opening up to 4+ browser tabs during a single session and spending, on average, 18 minutes in a comparison browsing mode before committing to purchase or abandoning the shopping session altogether.
A conservative estimate puts this browsing activity at a potential loss of $7.9 million USD in sales during a similar window of time.
Business metrics
- Reduction in time from initial comparison shopping to purchase decision.
- Increase in spending on consumer electronics items on amazon.com
- Degree of difficulty decreased via sentiment effort score
Design process
Discover
How might we reduce friction in the consideration phase of the purchasing journey?
- Customer interviews
Define
What's the most opportune moment to remove friction?
- Qualitative synthesis
Develop
How might we make comparison shopping easier on mobile and desktop?
- Rapid prototyping
- Usability testing
Deliver
Present clear evidence on the design process
- Final design / Redlines
Discovery phase
Discover insights into the problem by uncovering the problem space
As previously mentioned, UX researchers created a study around comparison shopping and watched participants engage in this activity. Participants were pre-screened to be actively looking at a large purchase specifically within the consumer electronics space. These participants were instructed to research and find their specific products.
We had a large set of data with hours of footage to comb through and synthesize.
Definition phase
Defining the area to focus efforts
After pulling the initial data from the interview sessions, we created an affinity map that pulled together common behaviors. By mapping it all out, we were able to visibly see patterns emerge.
- Find products through Google search.
- Locate a product of interest on amazon.com.
- Search for product on amazon.com through the navigation.
- "Command + Click" to open multiple browser tabs of each product of interest from the search results page.
- Begin to look through each product detail page.
- Once they spotted a specification on the product, they went through each of the open browser tabs to check and verify whether or not the other products had more or less than the interested product page.
- Other specifications were compared in this way.
- Purchase

Our team quickly realized that if we combined the efforts of opening multiple tabs with the specification matching activity, then we would be able to reduce the total amount of time spent comparing products as well increase the level of confidence in their search.
By making these observations, and by combining some of these steps together, we can bring total number of steps from eight to five, this would be most ideal for our cusomters.
- Find products through Google search.
- Locate a product of interest on amazon.com.
- Search for product on amazon.com through the navigation.
- Comparison activity
- Purchase
Develop
Develop potential solutions aka prototyping
With our definition in hand, we set out to explore different methods of how this would work. Although our UX research primarily occurred on a desktop computer, we didn't want to rule out this kind of activity on a mobile device. We increased our scope for exploration to both a mobile device as well as a desktop computer.
We drew from analog experiences such as the act of picking produce from the grocery store. Comparing one grape to another.
In our initial explorations, we immediately thought about other comparison behaviors outside of the tech world. When picking produce at the grocery store, you pick up a specimen and bring it close. You pick up another one and bring it close. If you're comparison two items, you bring them together. This was the basis of our main interactions.
We first started off with trying to made the specifications easily scannable and keep the density of information small so that we could enable people to do that kind of close up comparison.
One of the biggest questions in this phase of work became: Do people want to actively select the products they want to compare or do they want to be given a list of similar items to compare from?
Explorations
In either case with mobile and desktop, we designed for both experiences and with the interactions of:
- Actively choosing products to compare against and
- Affordances to display similar products as a way for comparison shopping.
Mobile explorations
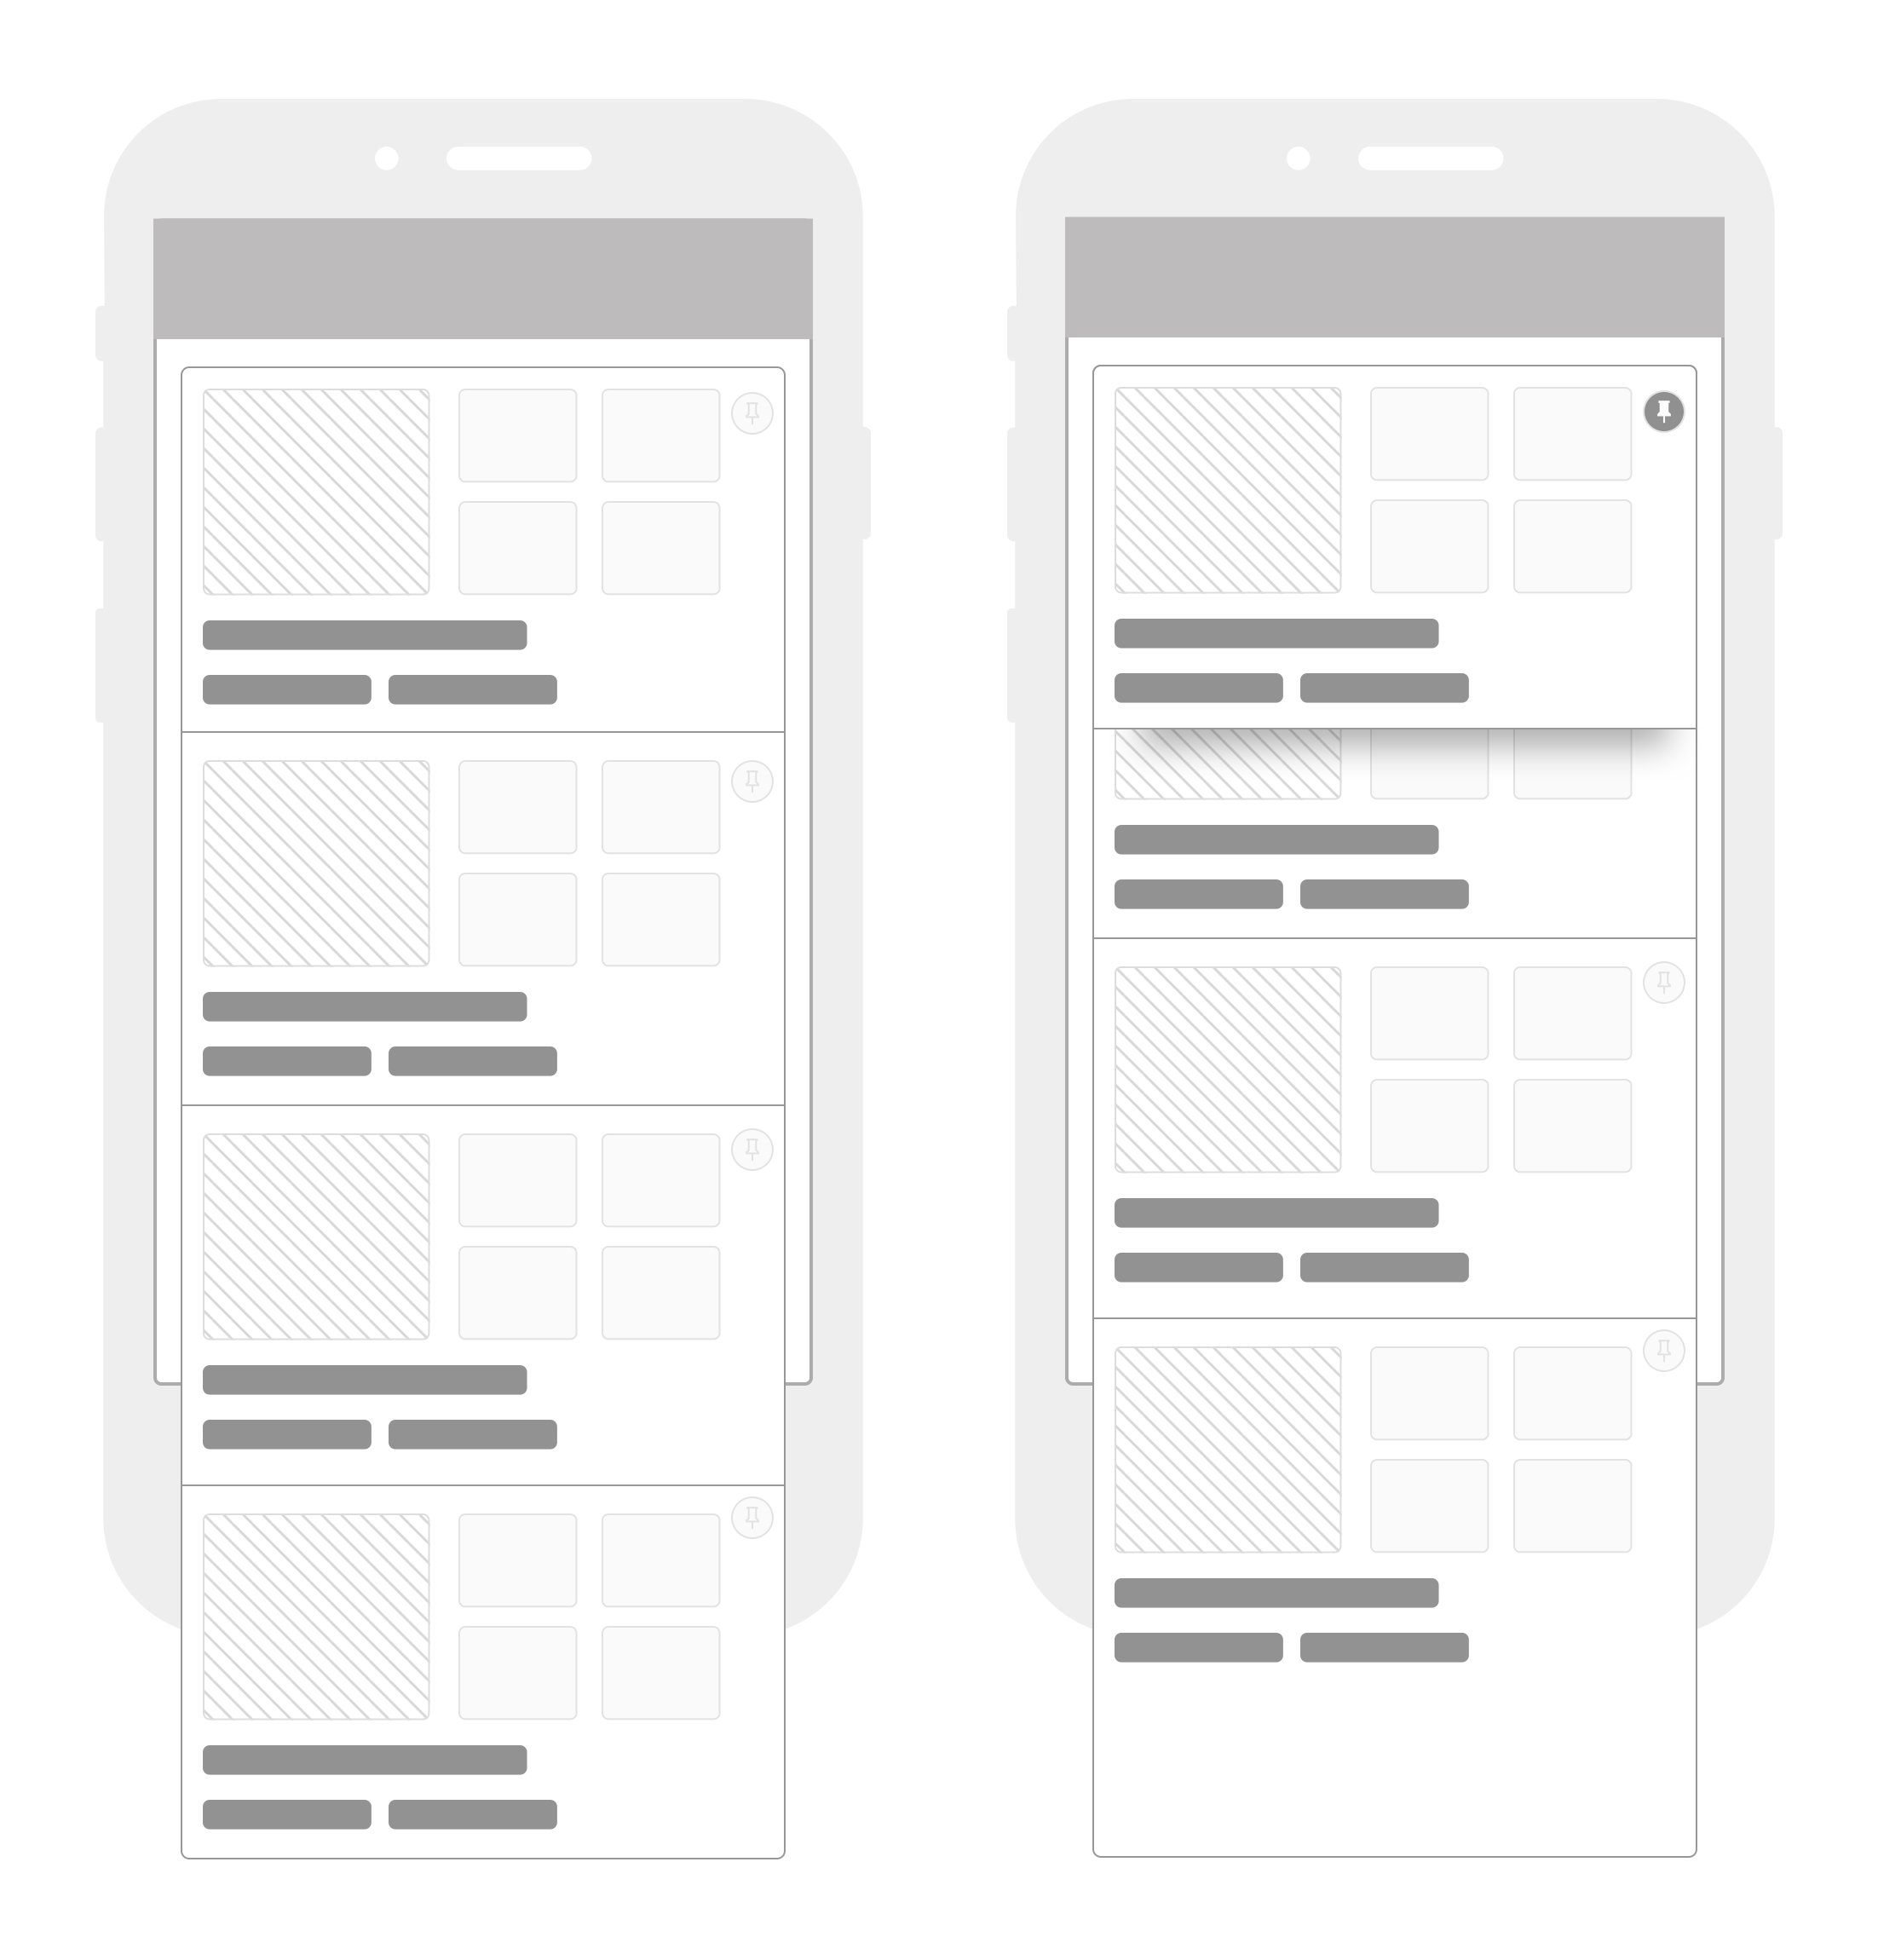
Early wireframe of the active comparison interaction
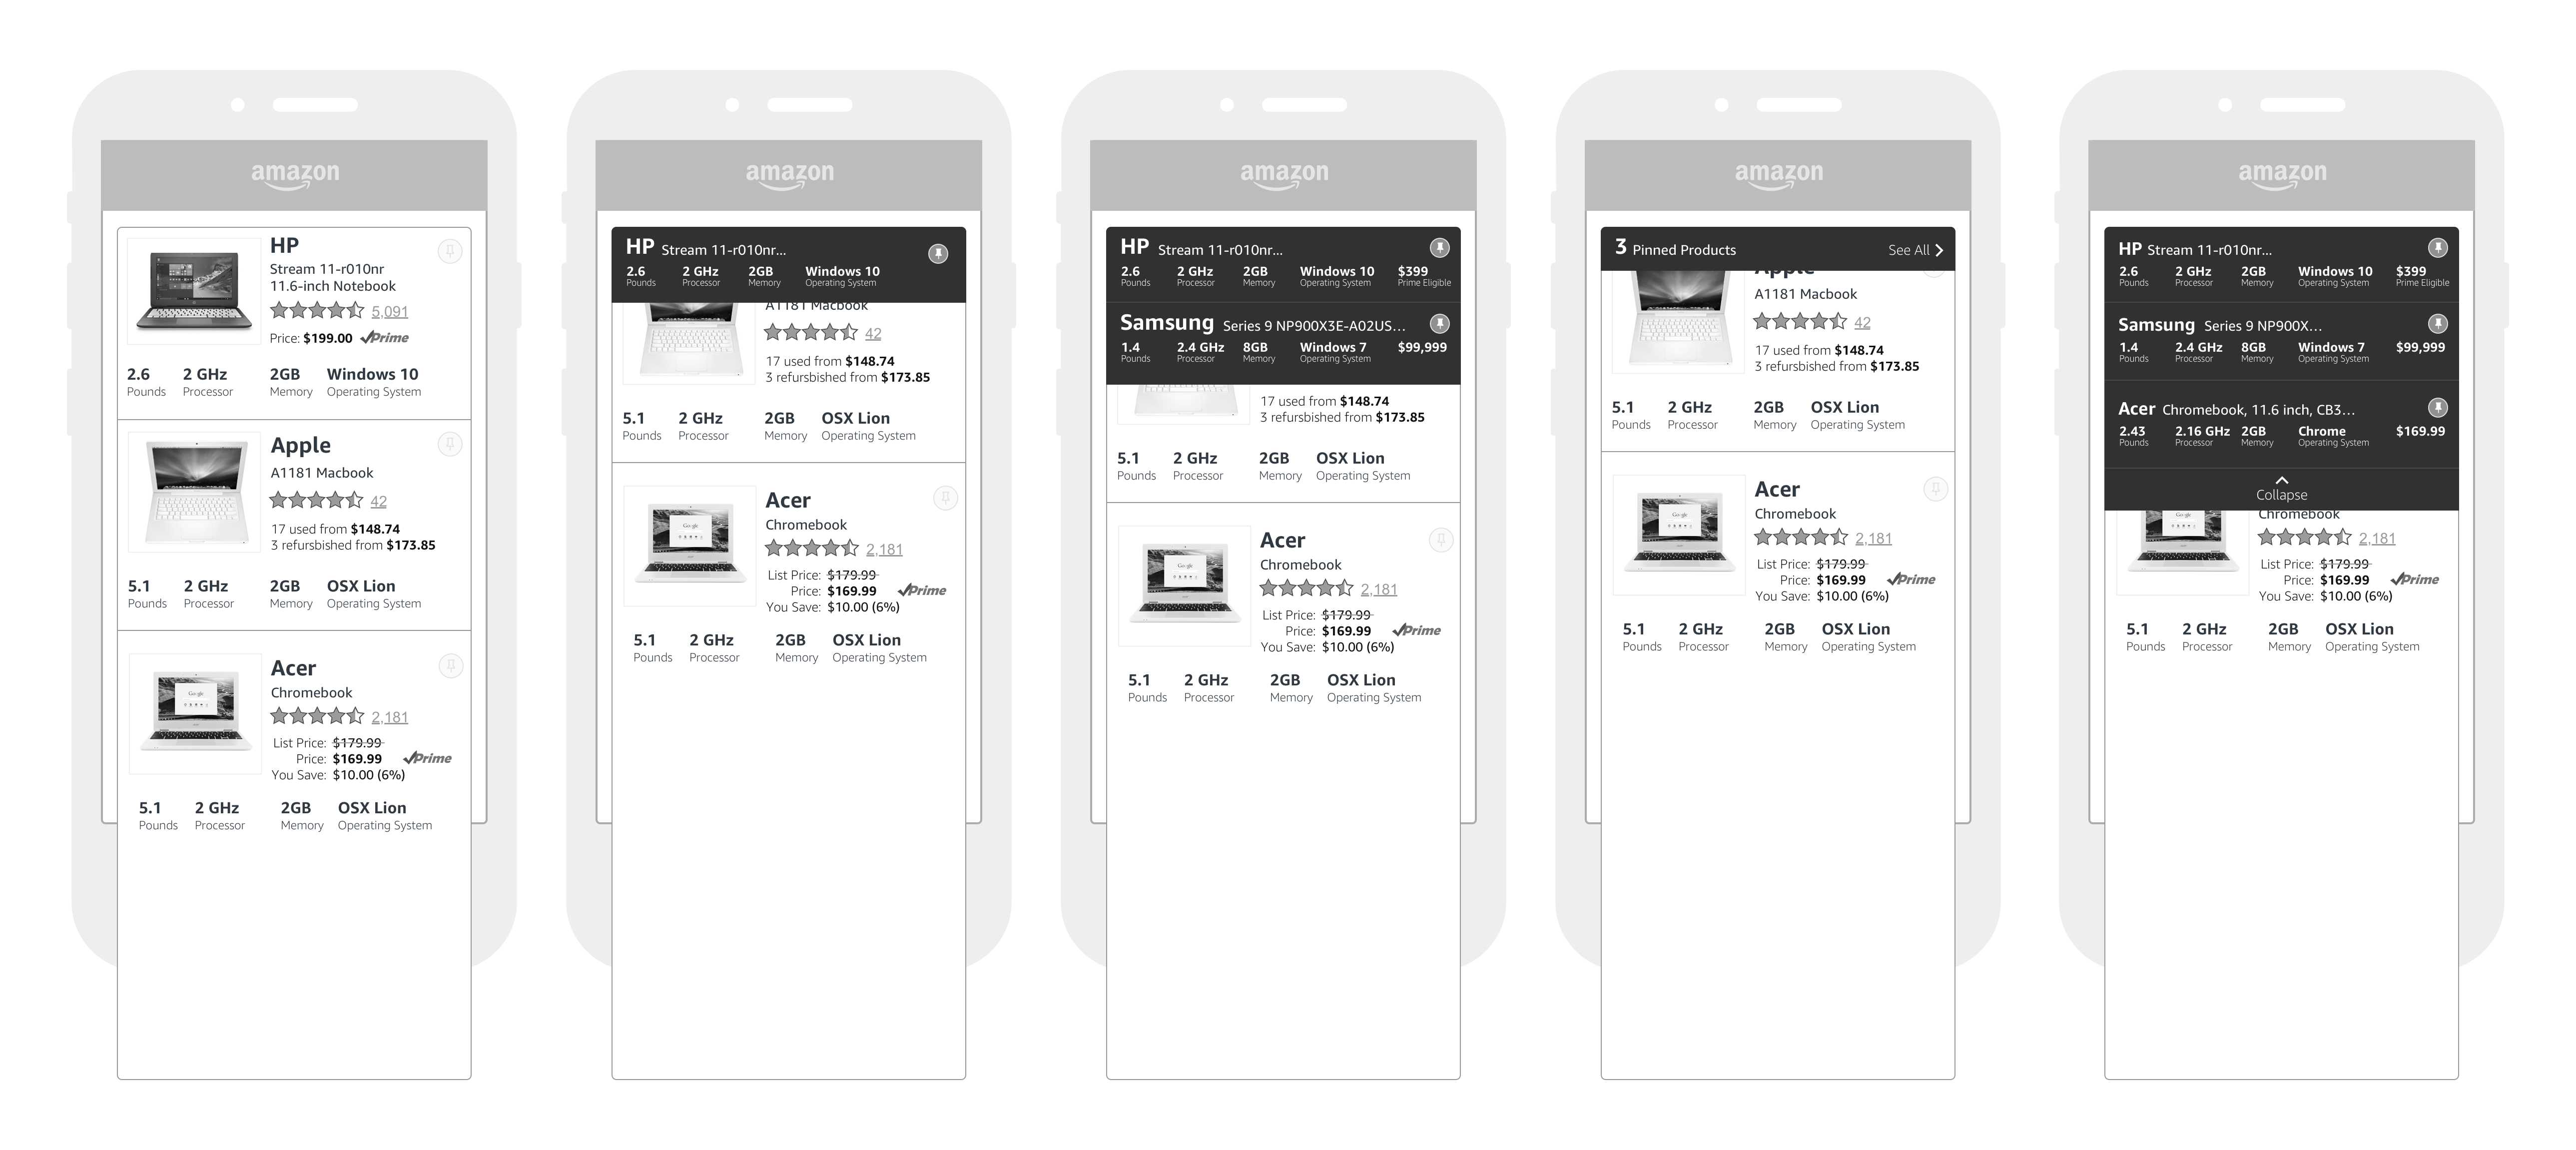
A bit more flushed out with more than one product getting pinned.
At this point, I went completely divergent in exploration and tried other interactions when it came to comparing specifications.
This one specifically looked at swiping on a row of specifications
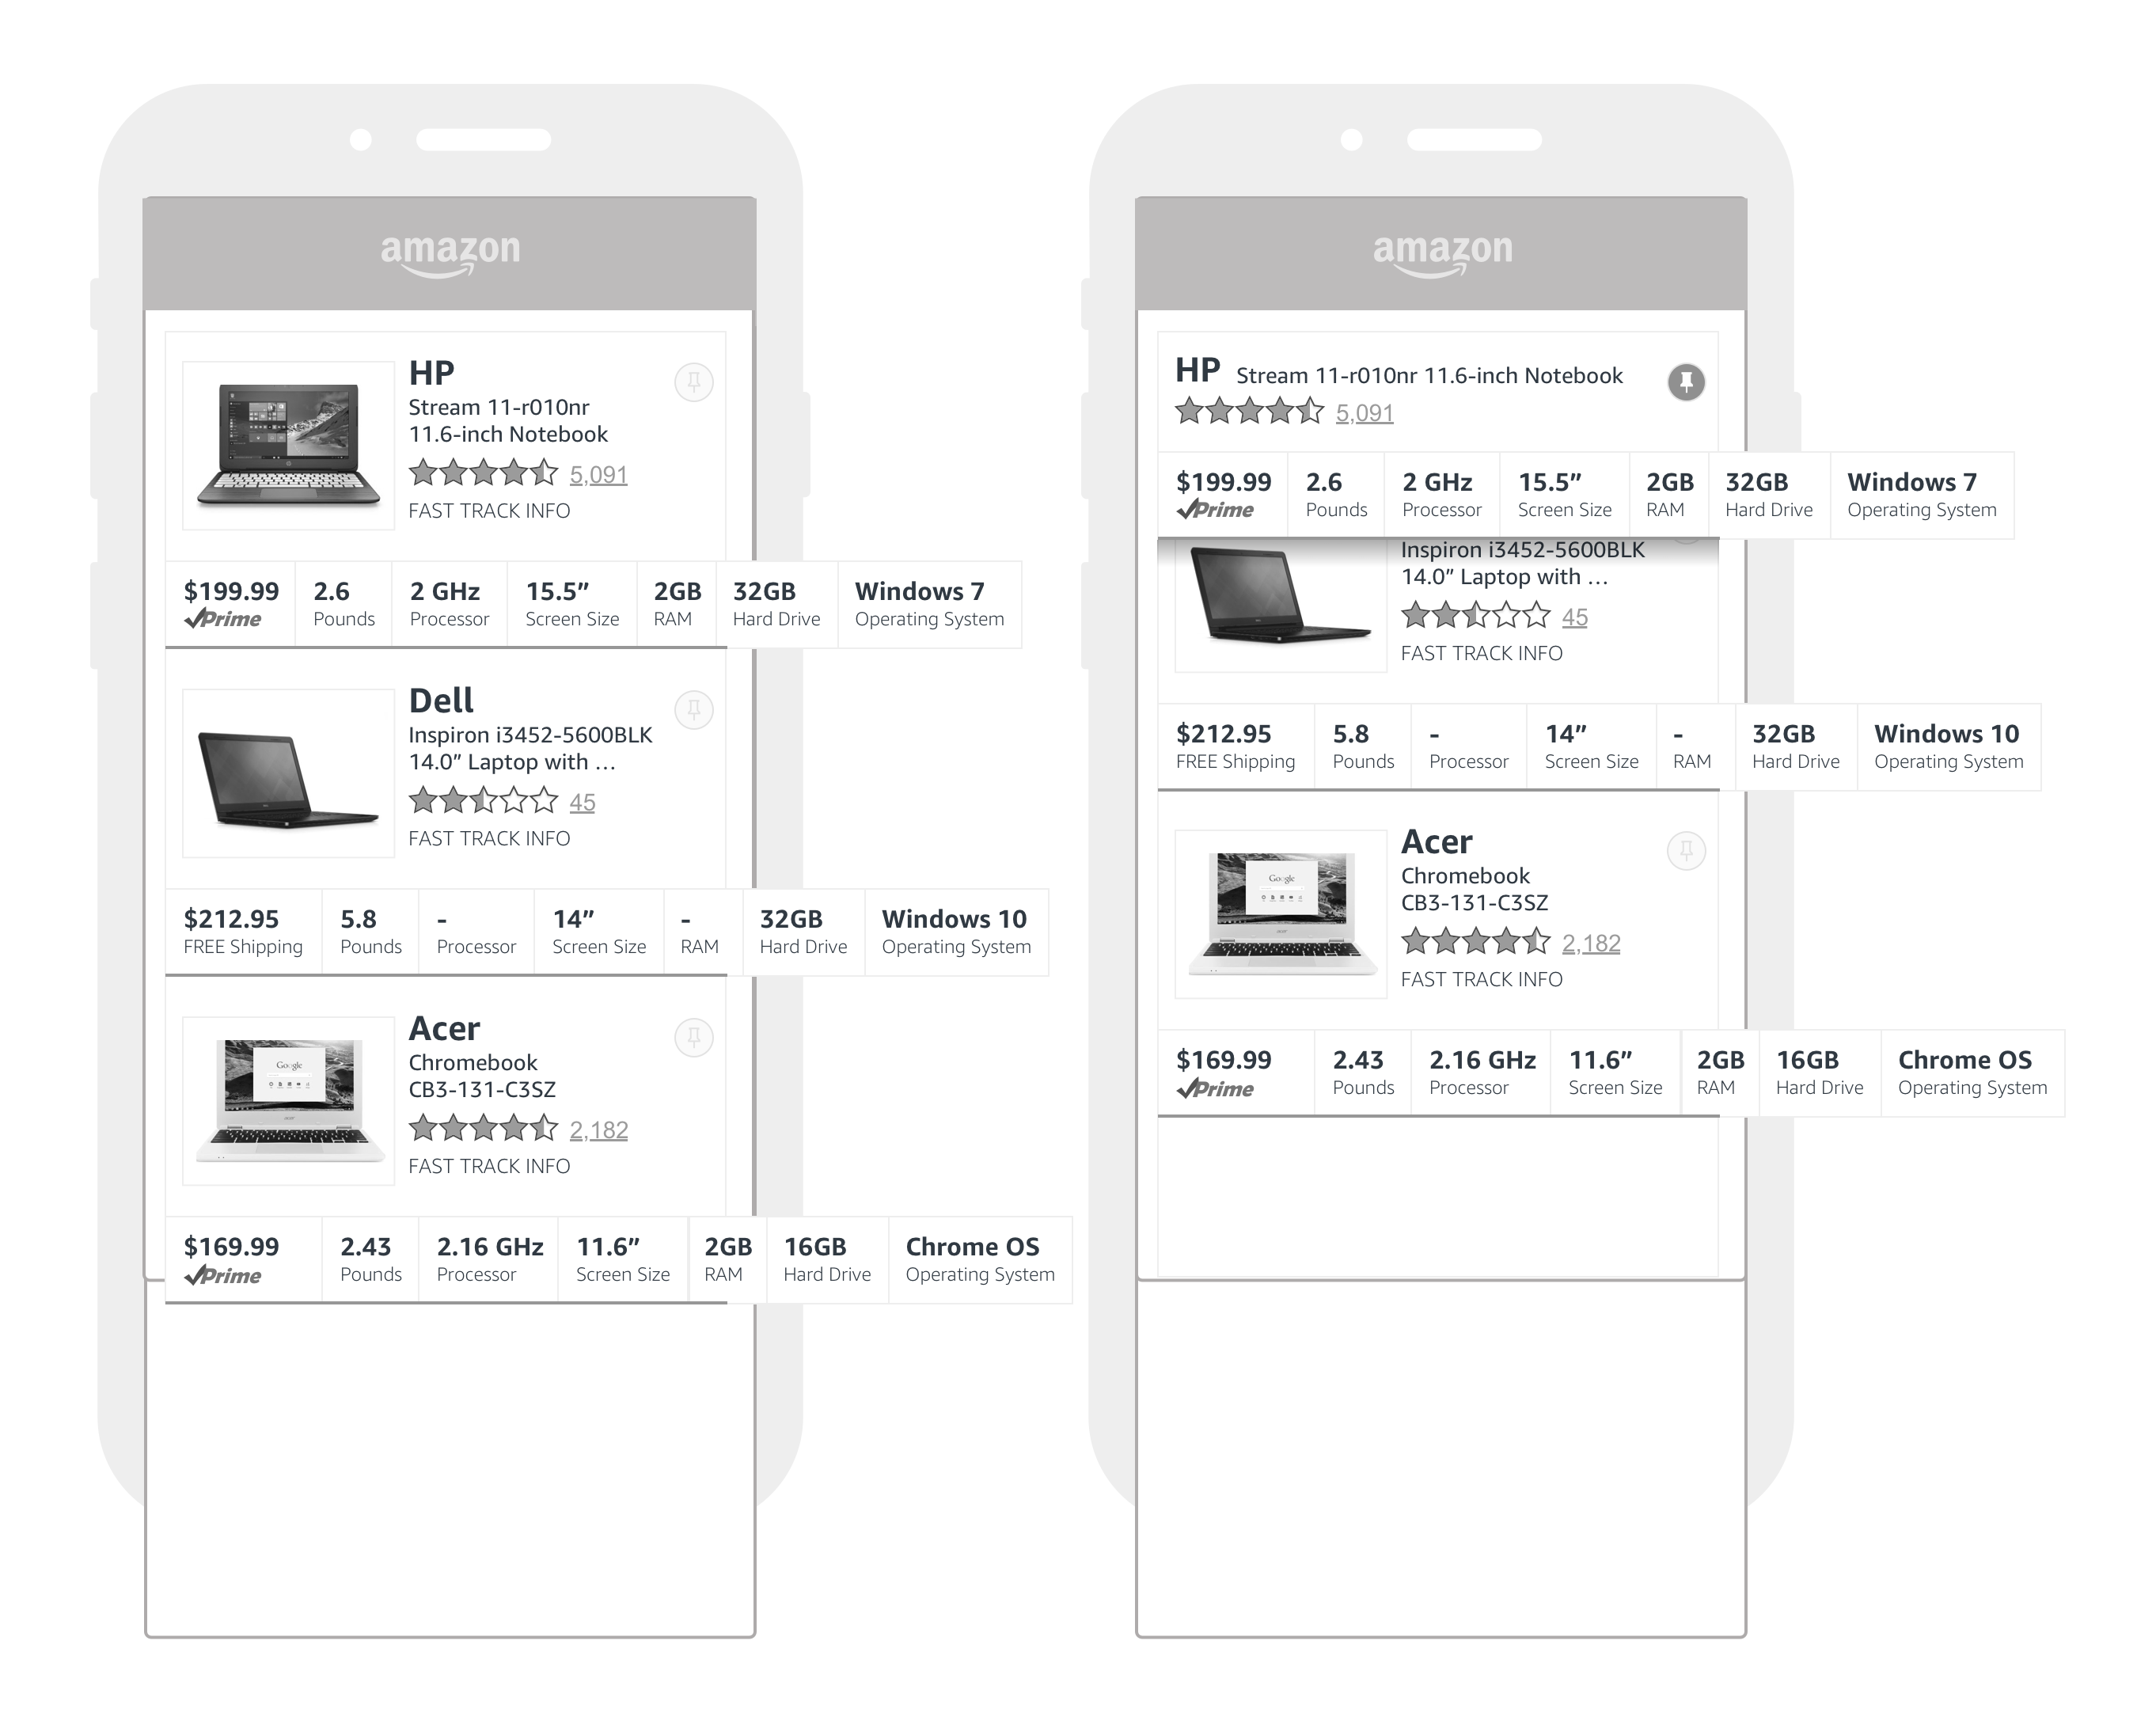
This exploration tried to capture filtering as a means for comparison
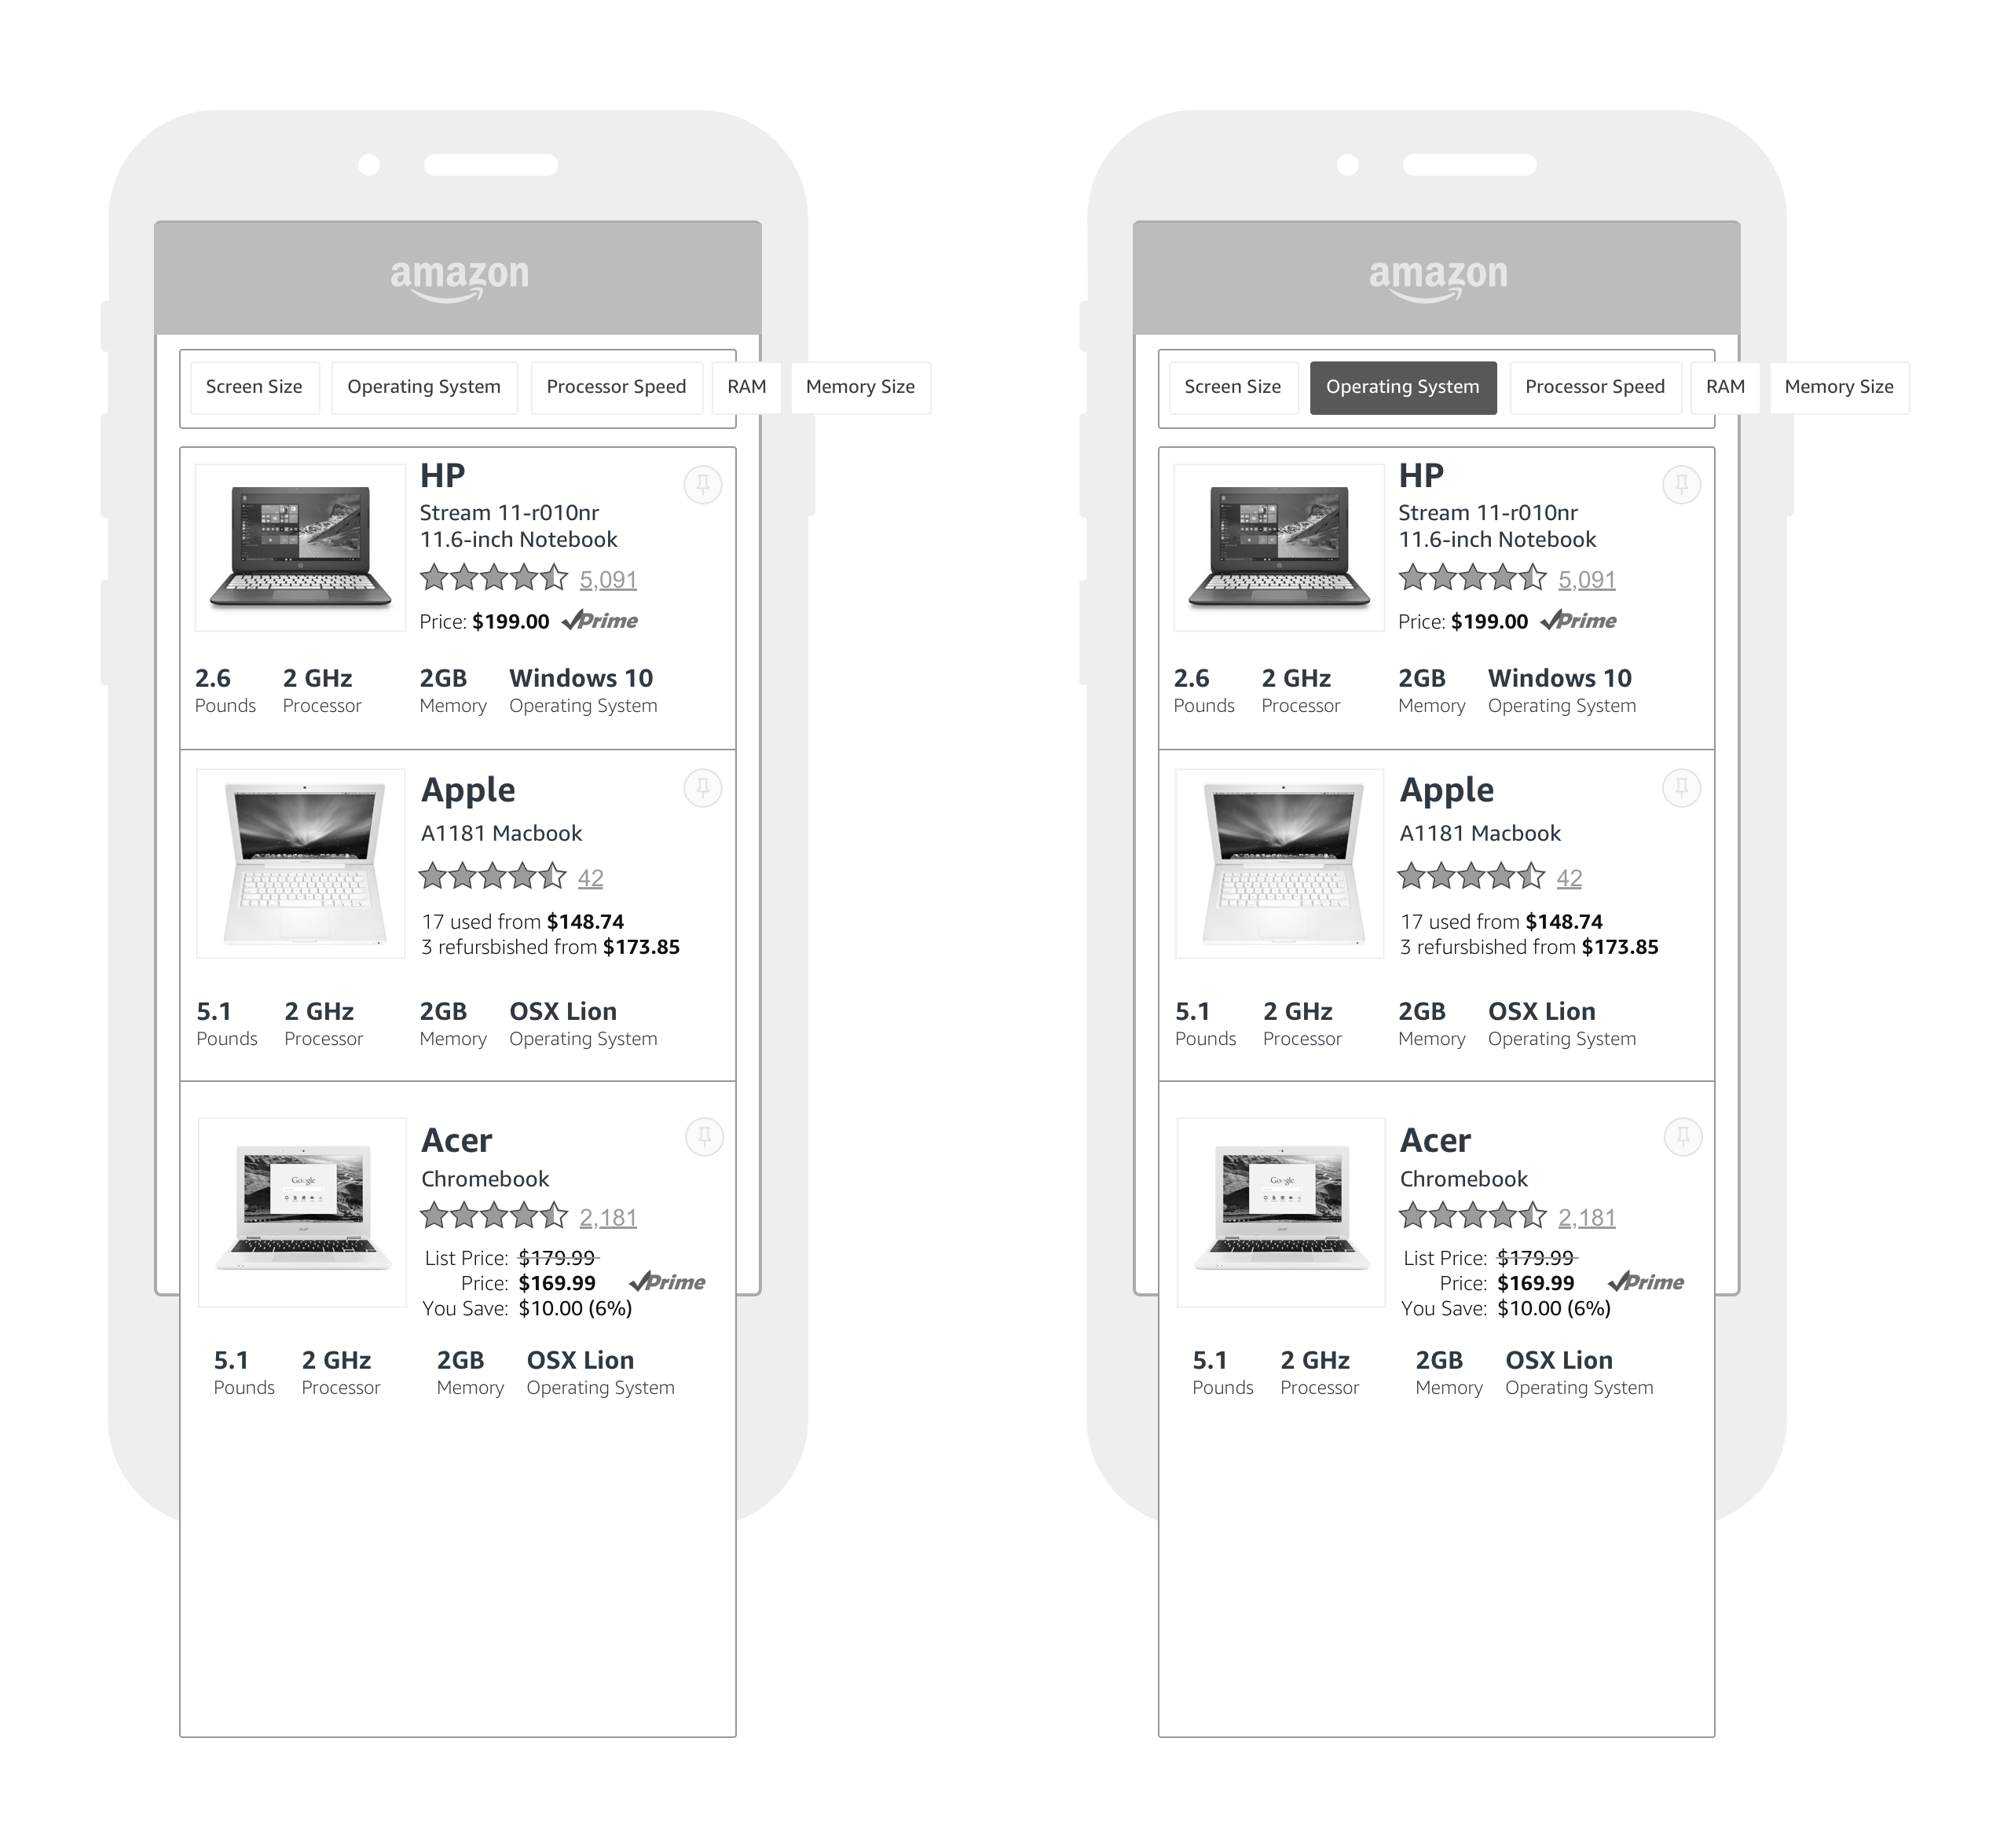
This is ultimately what we decided to built a prototype around and go and test users with.

Desktop explorations
It was prudent to start wireframing at a low fidelity to ensure we could talk about the concept rather than get bogged down in the particulars of the UI (typography, color, etc.). At this stage the team wanted to move fast and explore multiple concepts at a time.
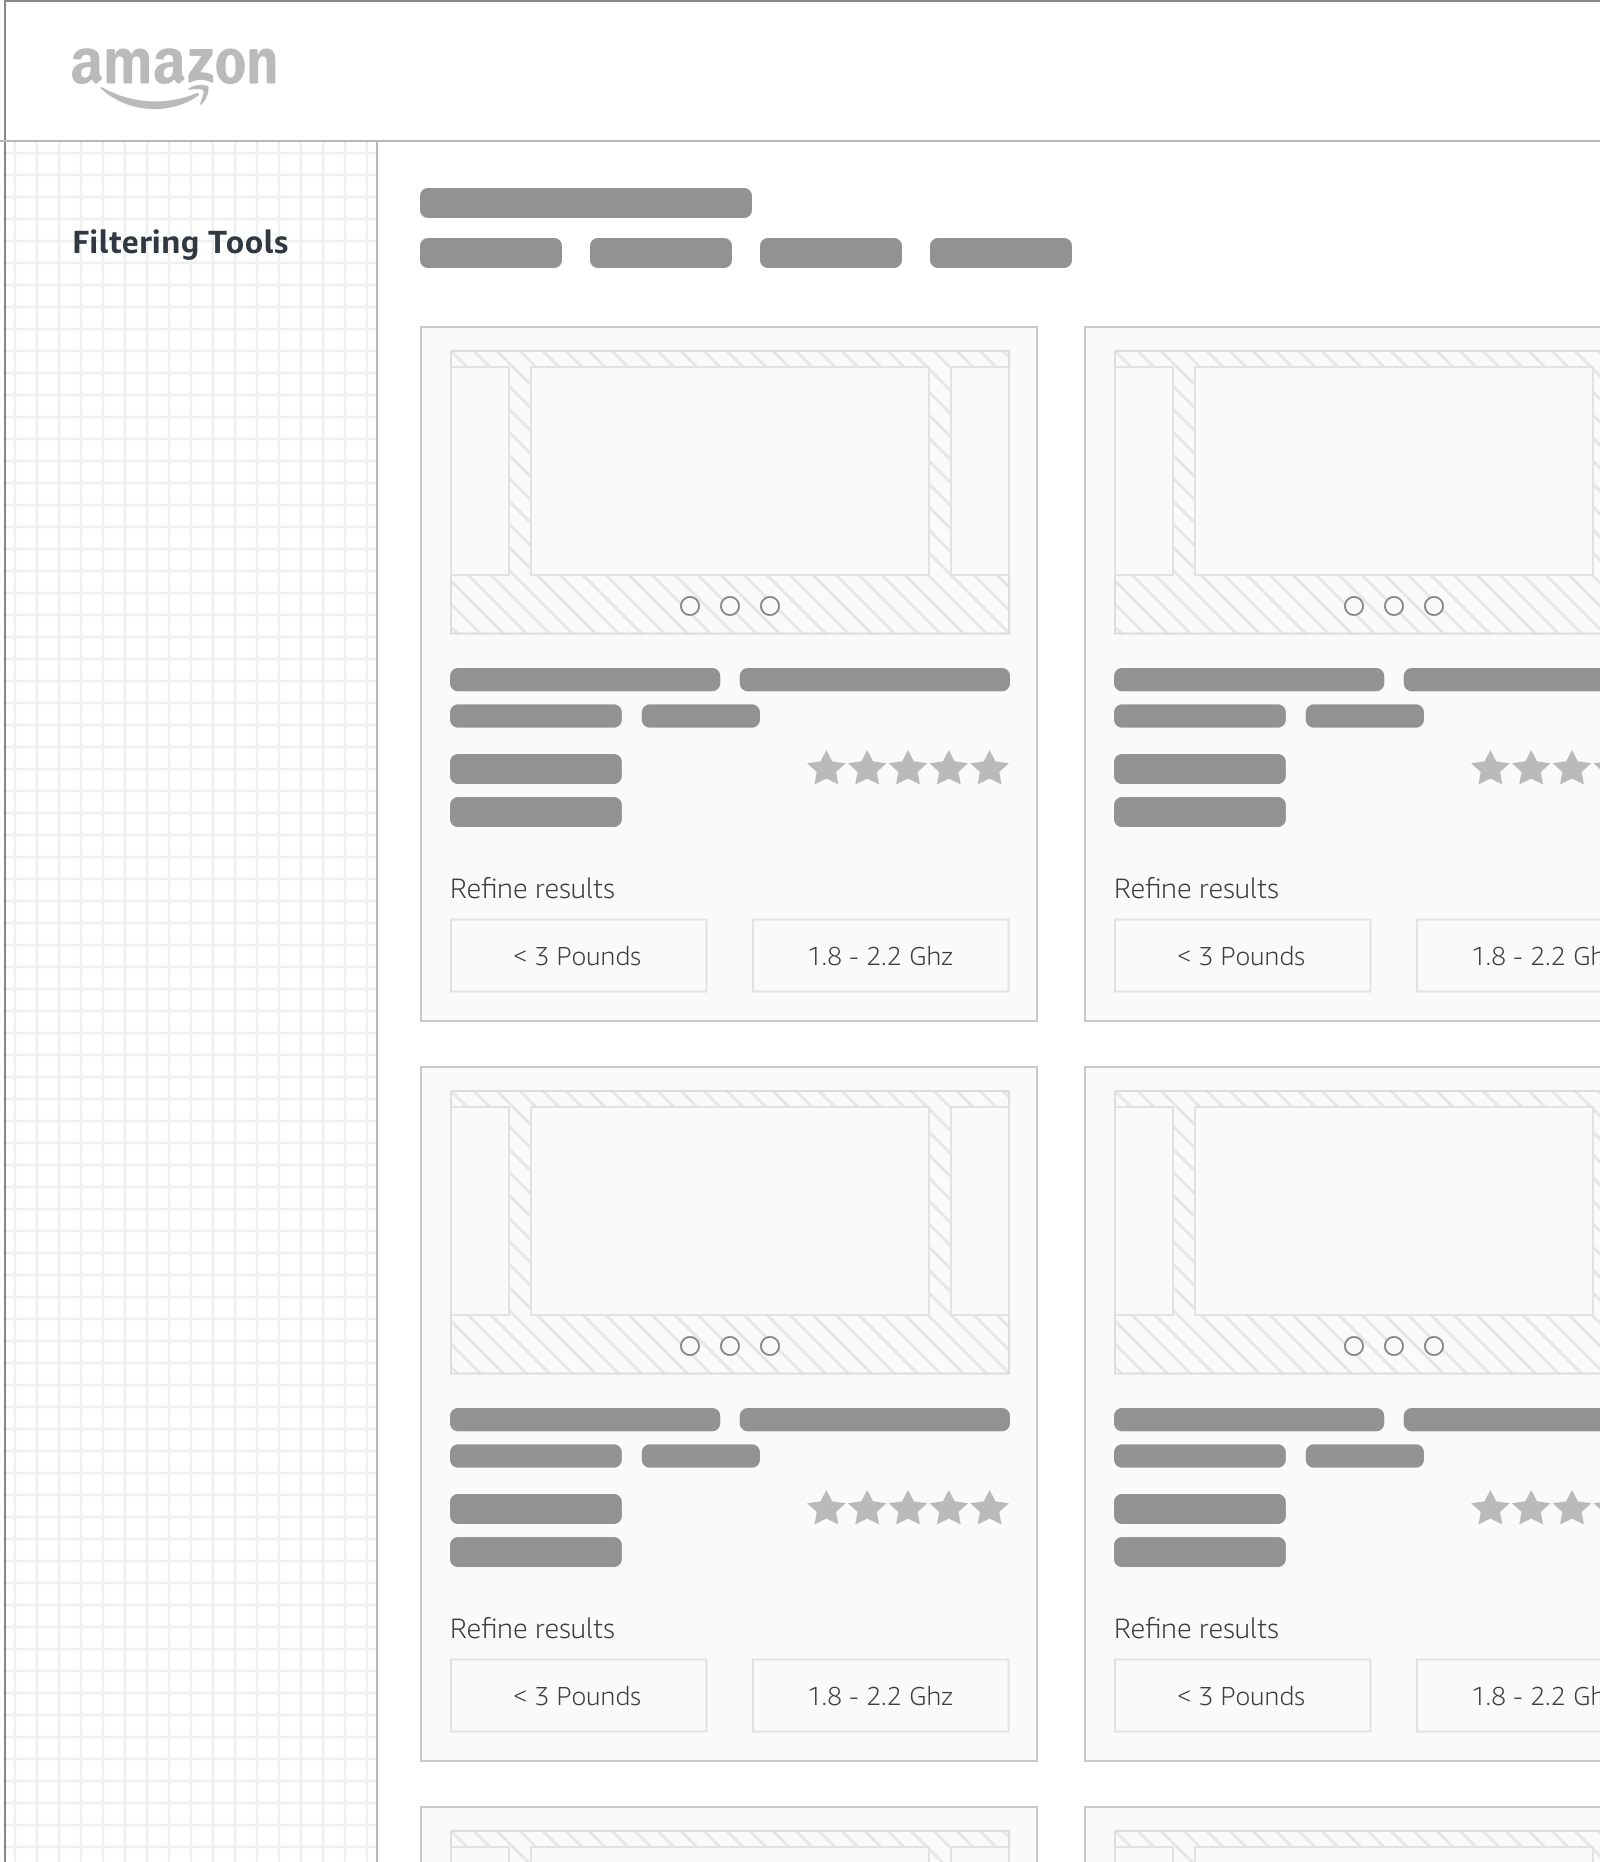
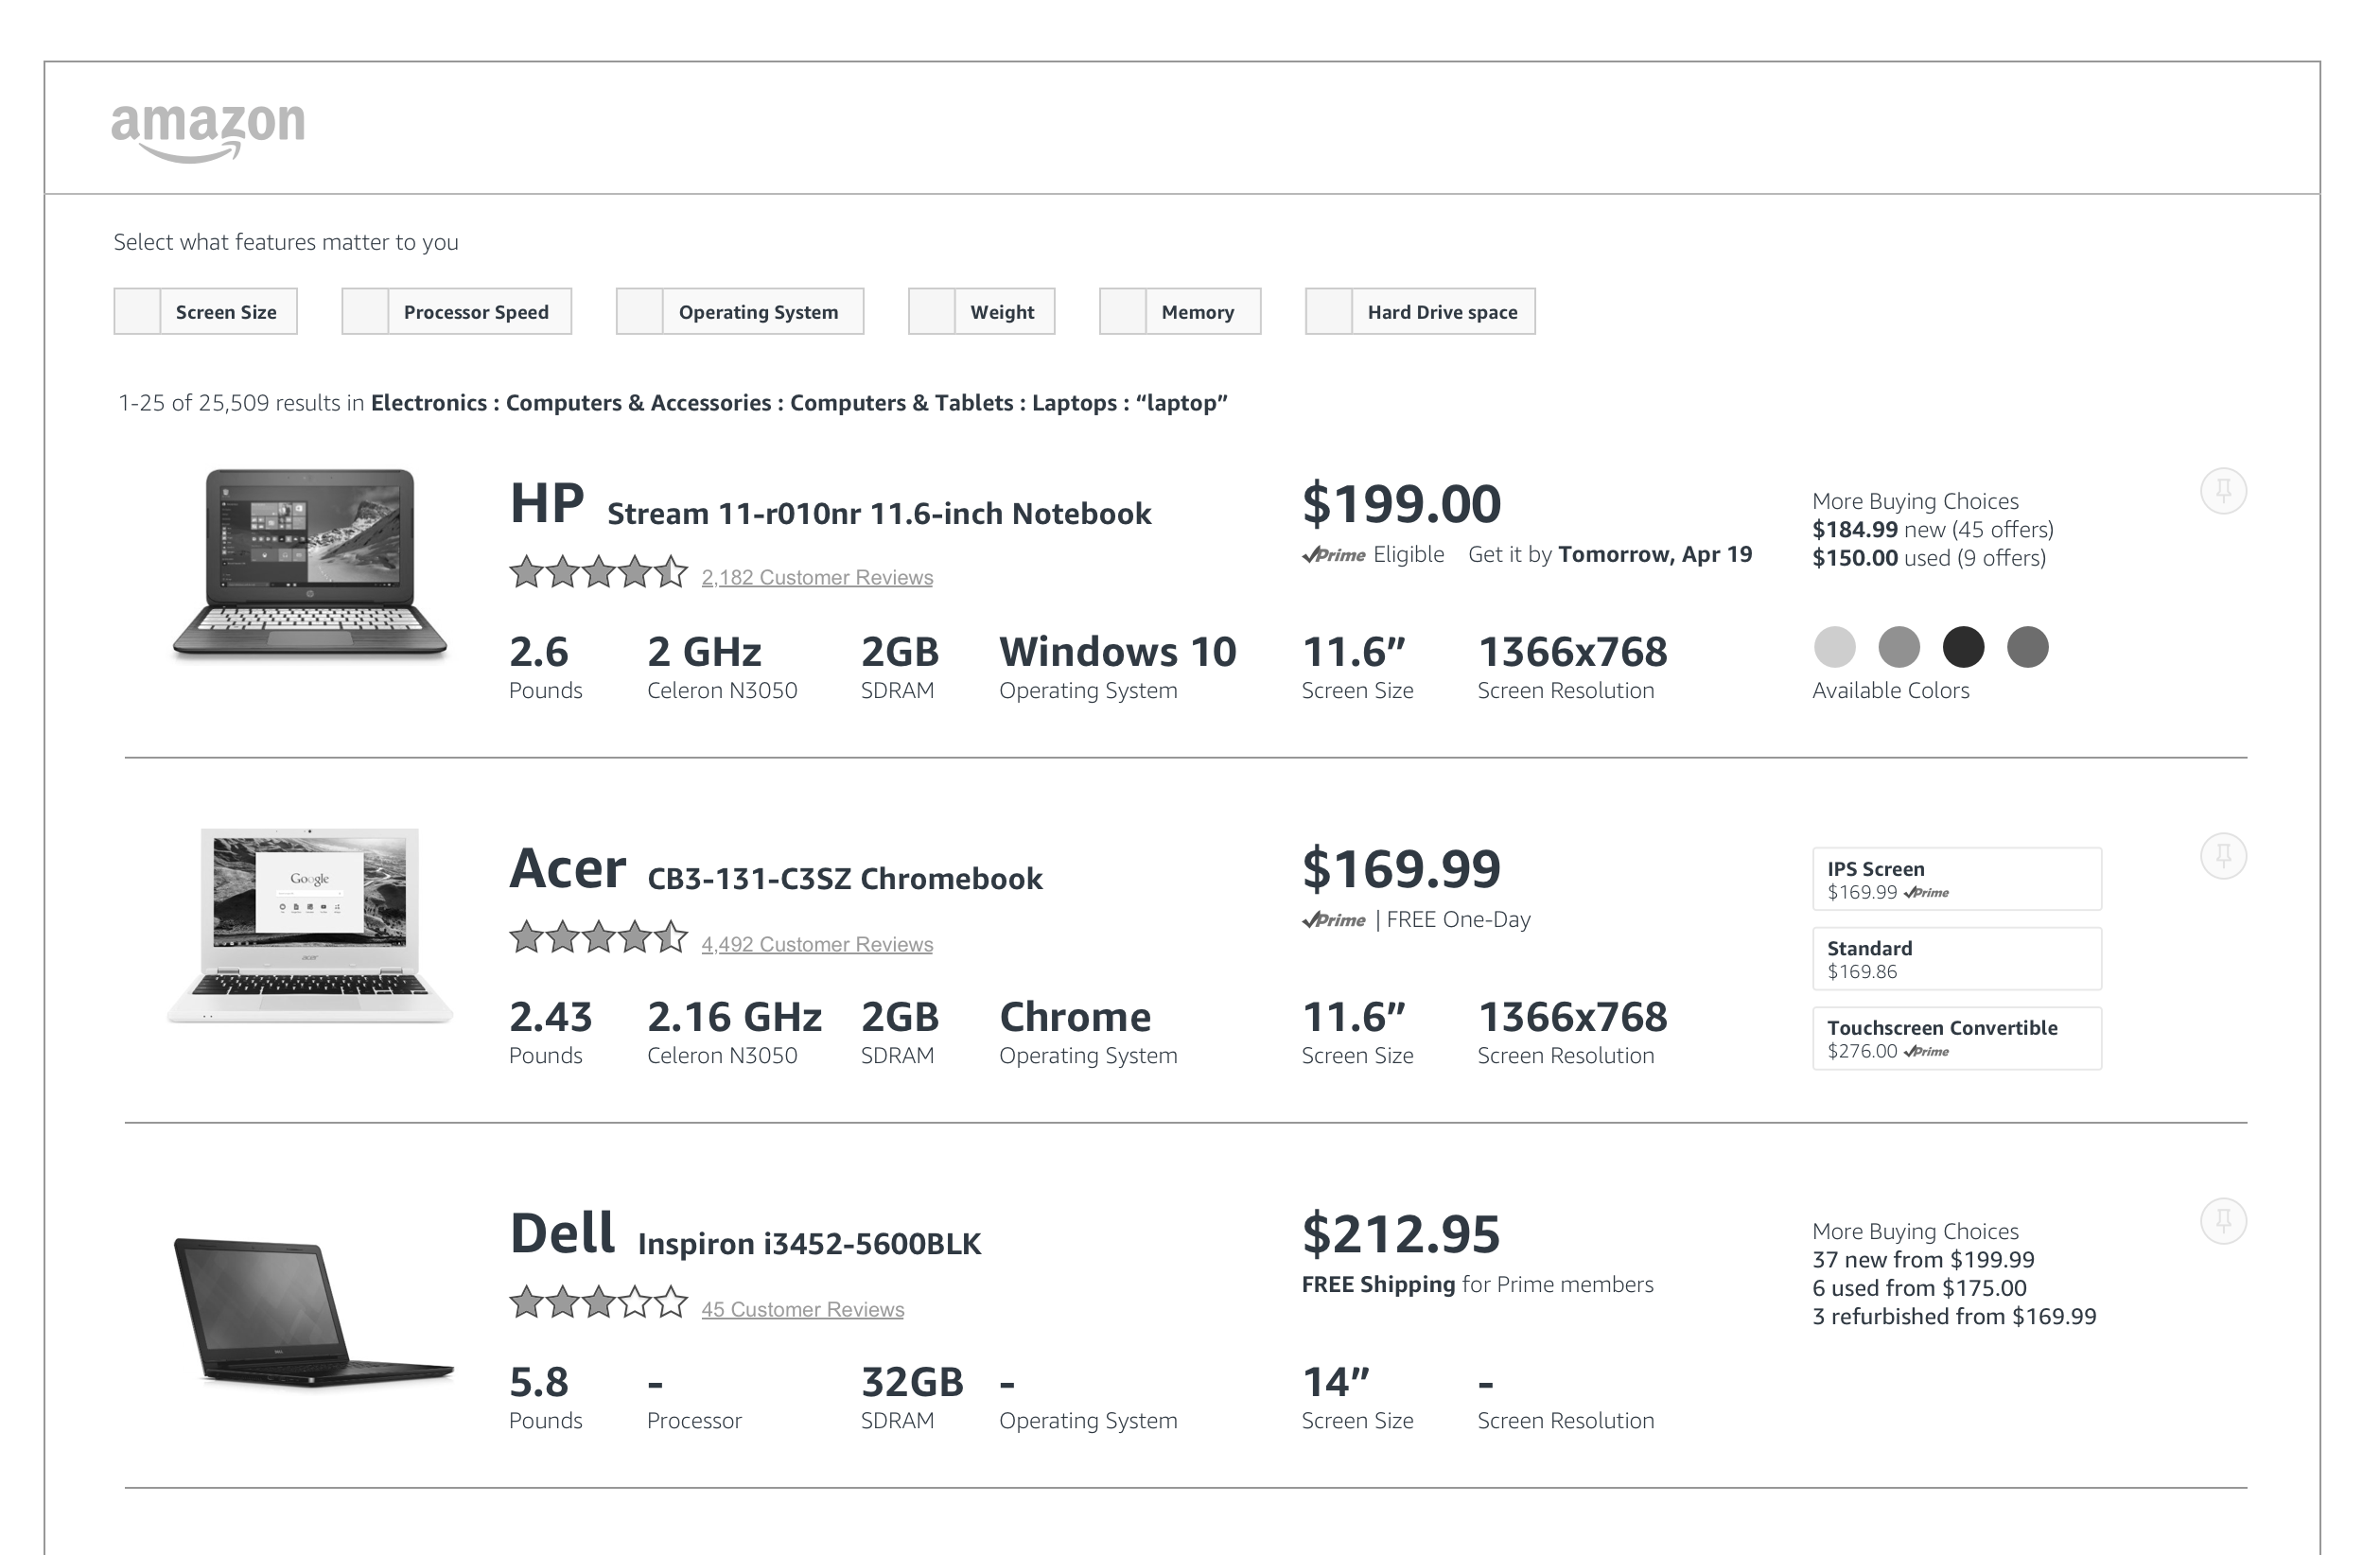
After some quick sketches, we quickly realized and agreed that it was important to group the following pieces of information together for comparison sake.
- Weight
- Processor speed
- Amount of RAM
- Operating system type
- Physical Screen size
- Screen resolution (in pixels)
But it was also important that these compliment the highest priority elements:
- Price
- Prime eligibility
- Ratings
- Brand
- Product photo
- Name of the product
I did some more divergent thinking and exploration and pulled on the thread for visualizing the amount of information we needed to display in clean and clear ways.
These are three different ways we designed the product specifications.
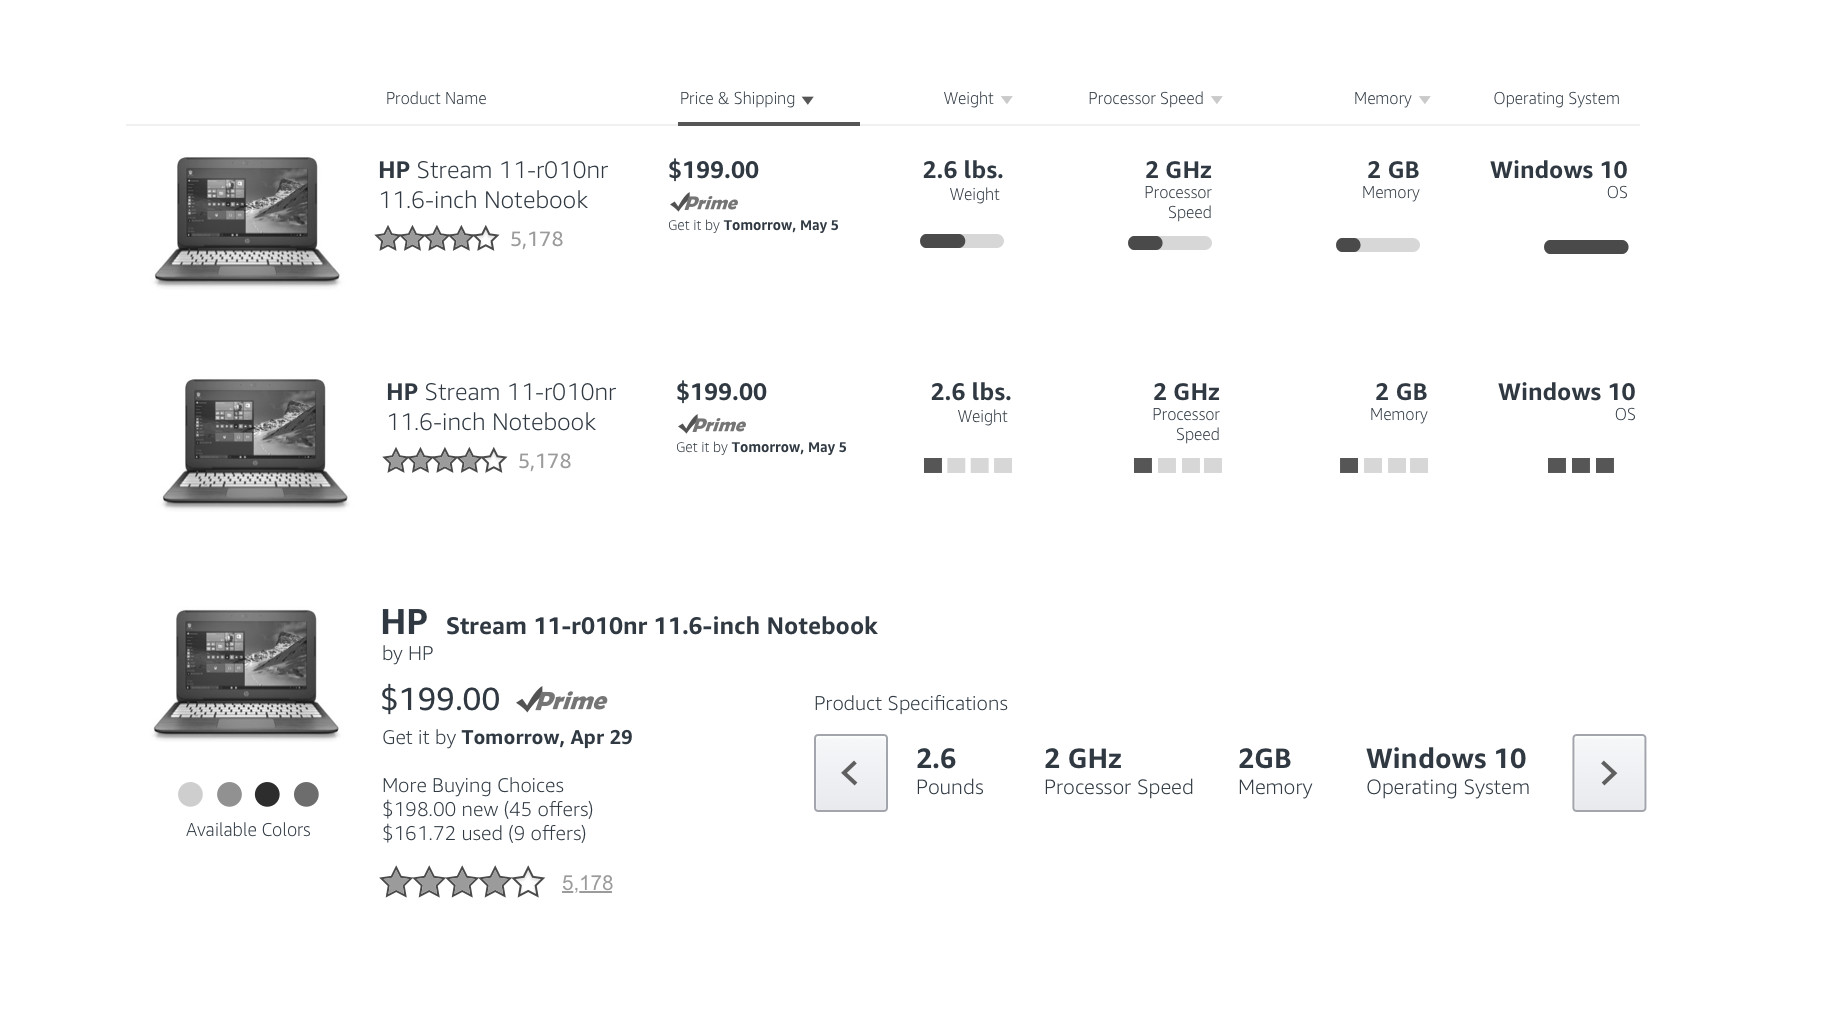
Through our quick ideation process we were able to determine which layout might serve our customers better - that being the product specifications lined up in a row so that our customers could compare one product to another as they scroll the page.
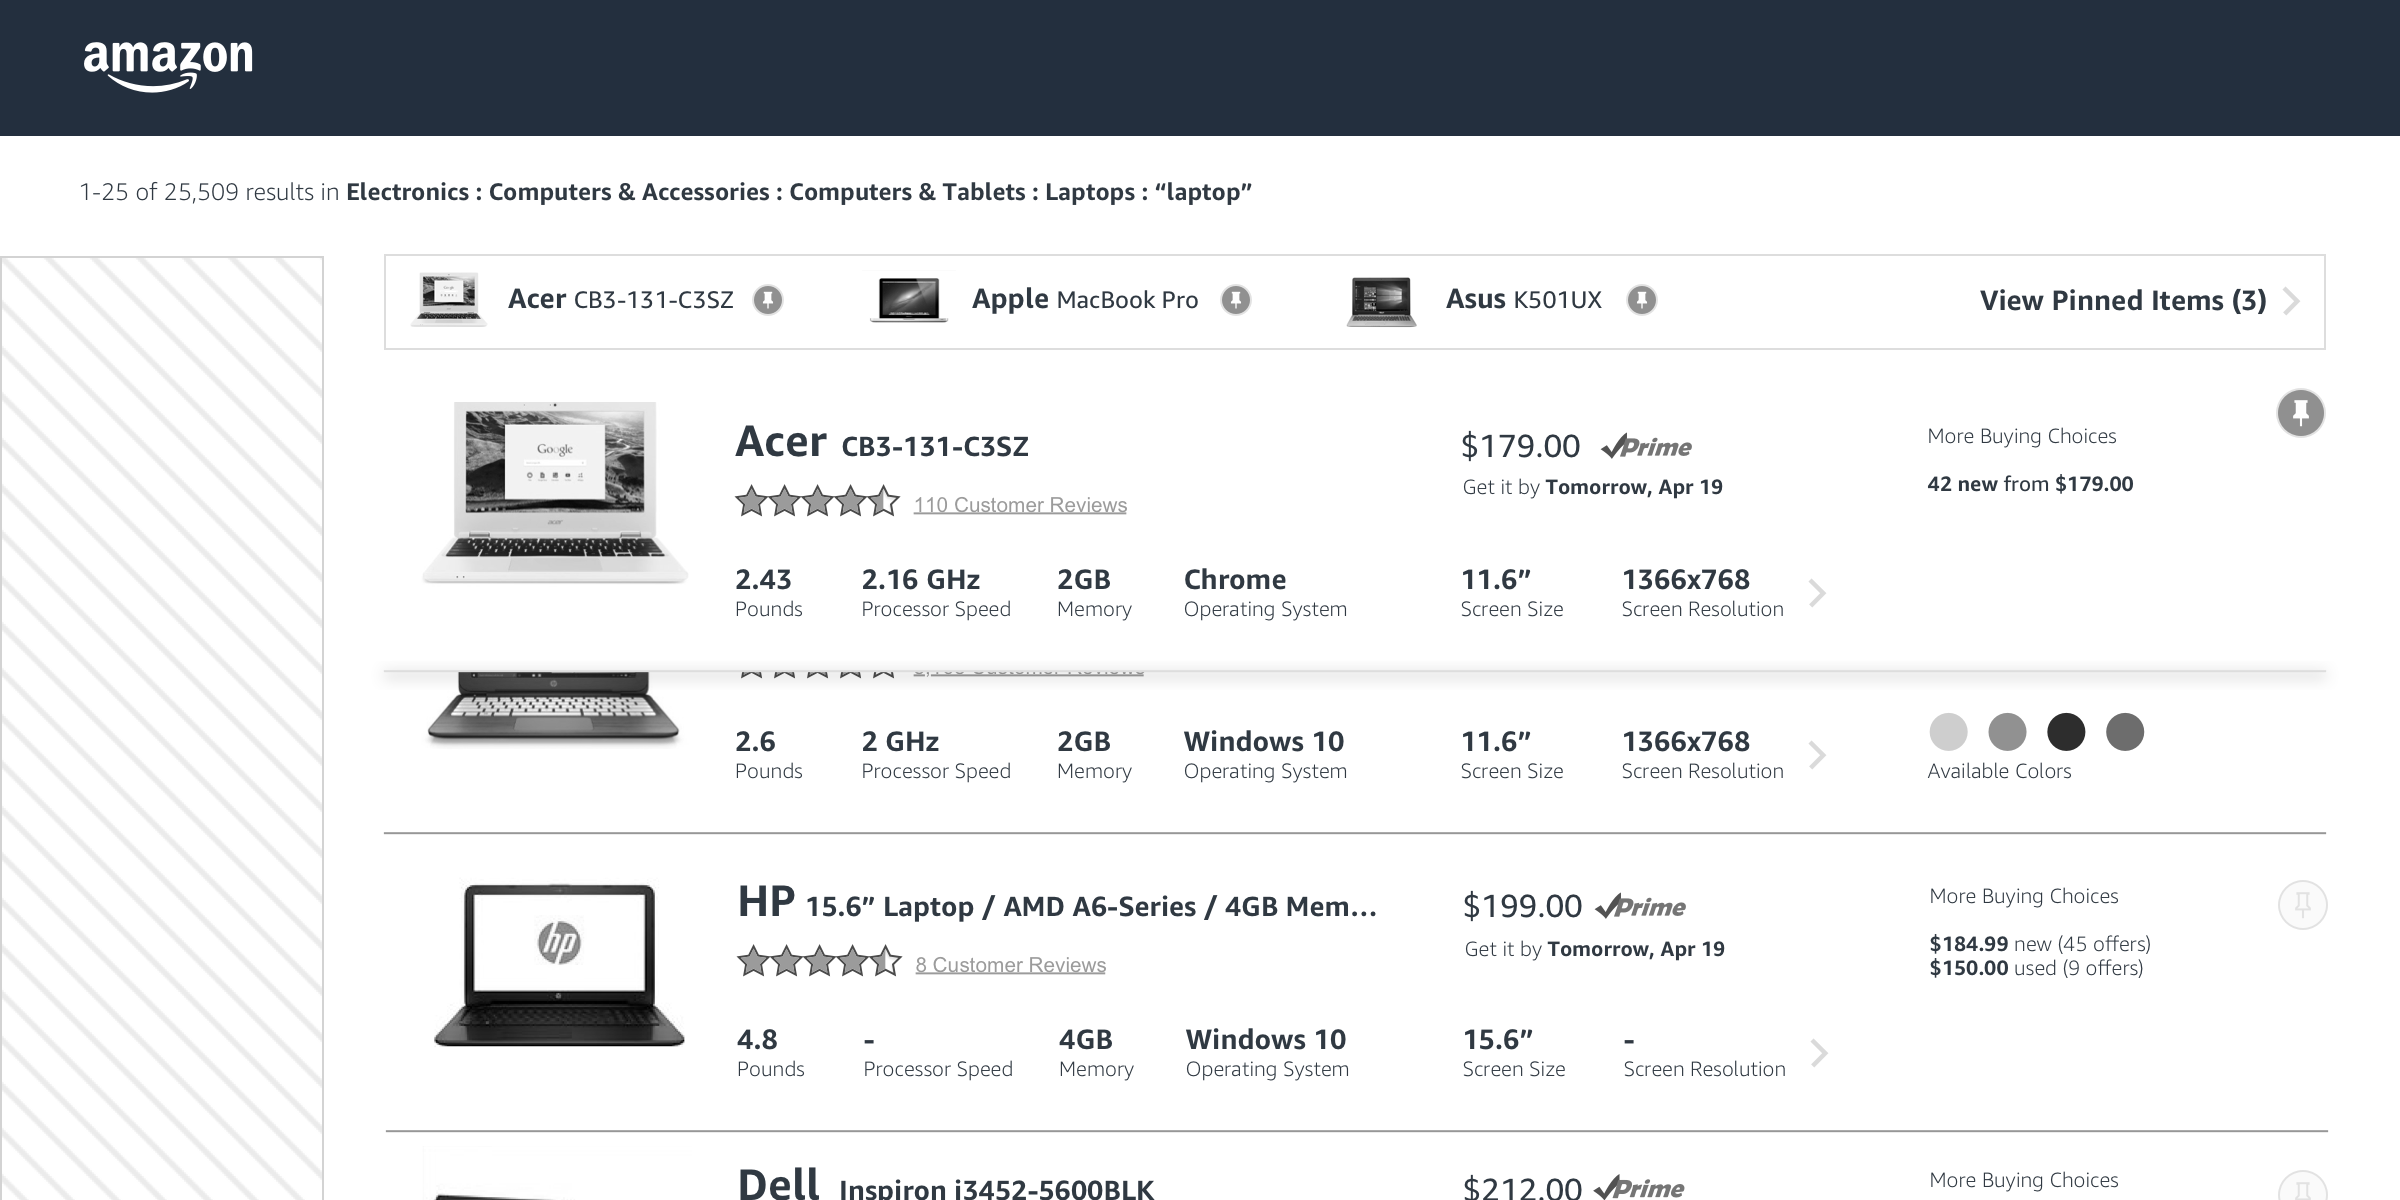
We then proceeded to design how a customer might be able to take a more active role in their comparison behavior – pin to compare.
Basic idea was to enable a customer to pin the product they wanted to compare with other products and it would affix to the top of the screen and then the customer could enter into a comparison mode to see the products selected.
With a higher degree of confidence towards the version that we wanted to test with customers, we started to increase the fidelity and matching that with the current amazon.com site.
I explored a tray concept that would help customers know where their pinned products were and how to manage the pinned status of each product.
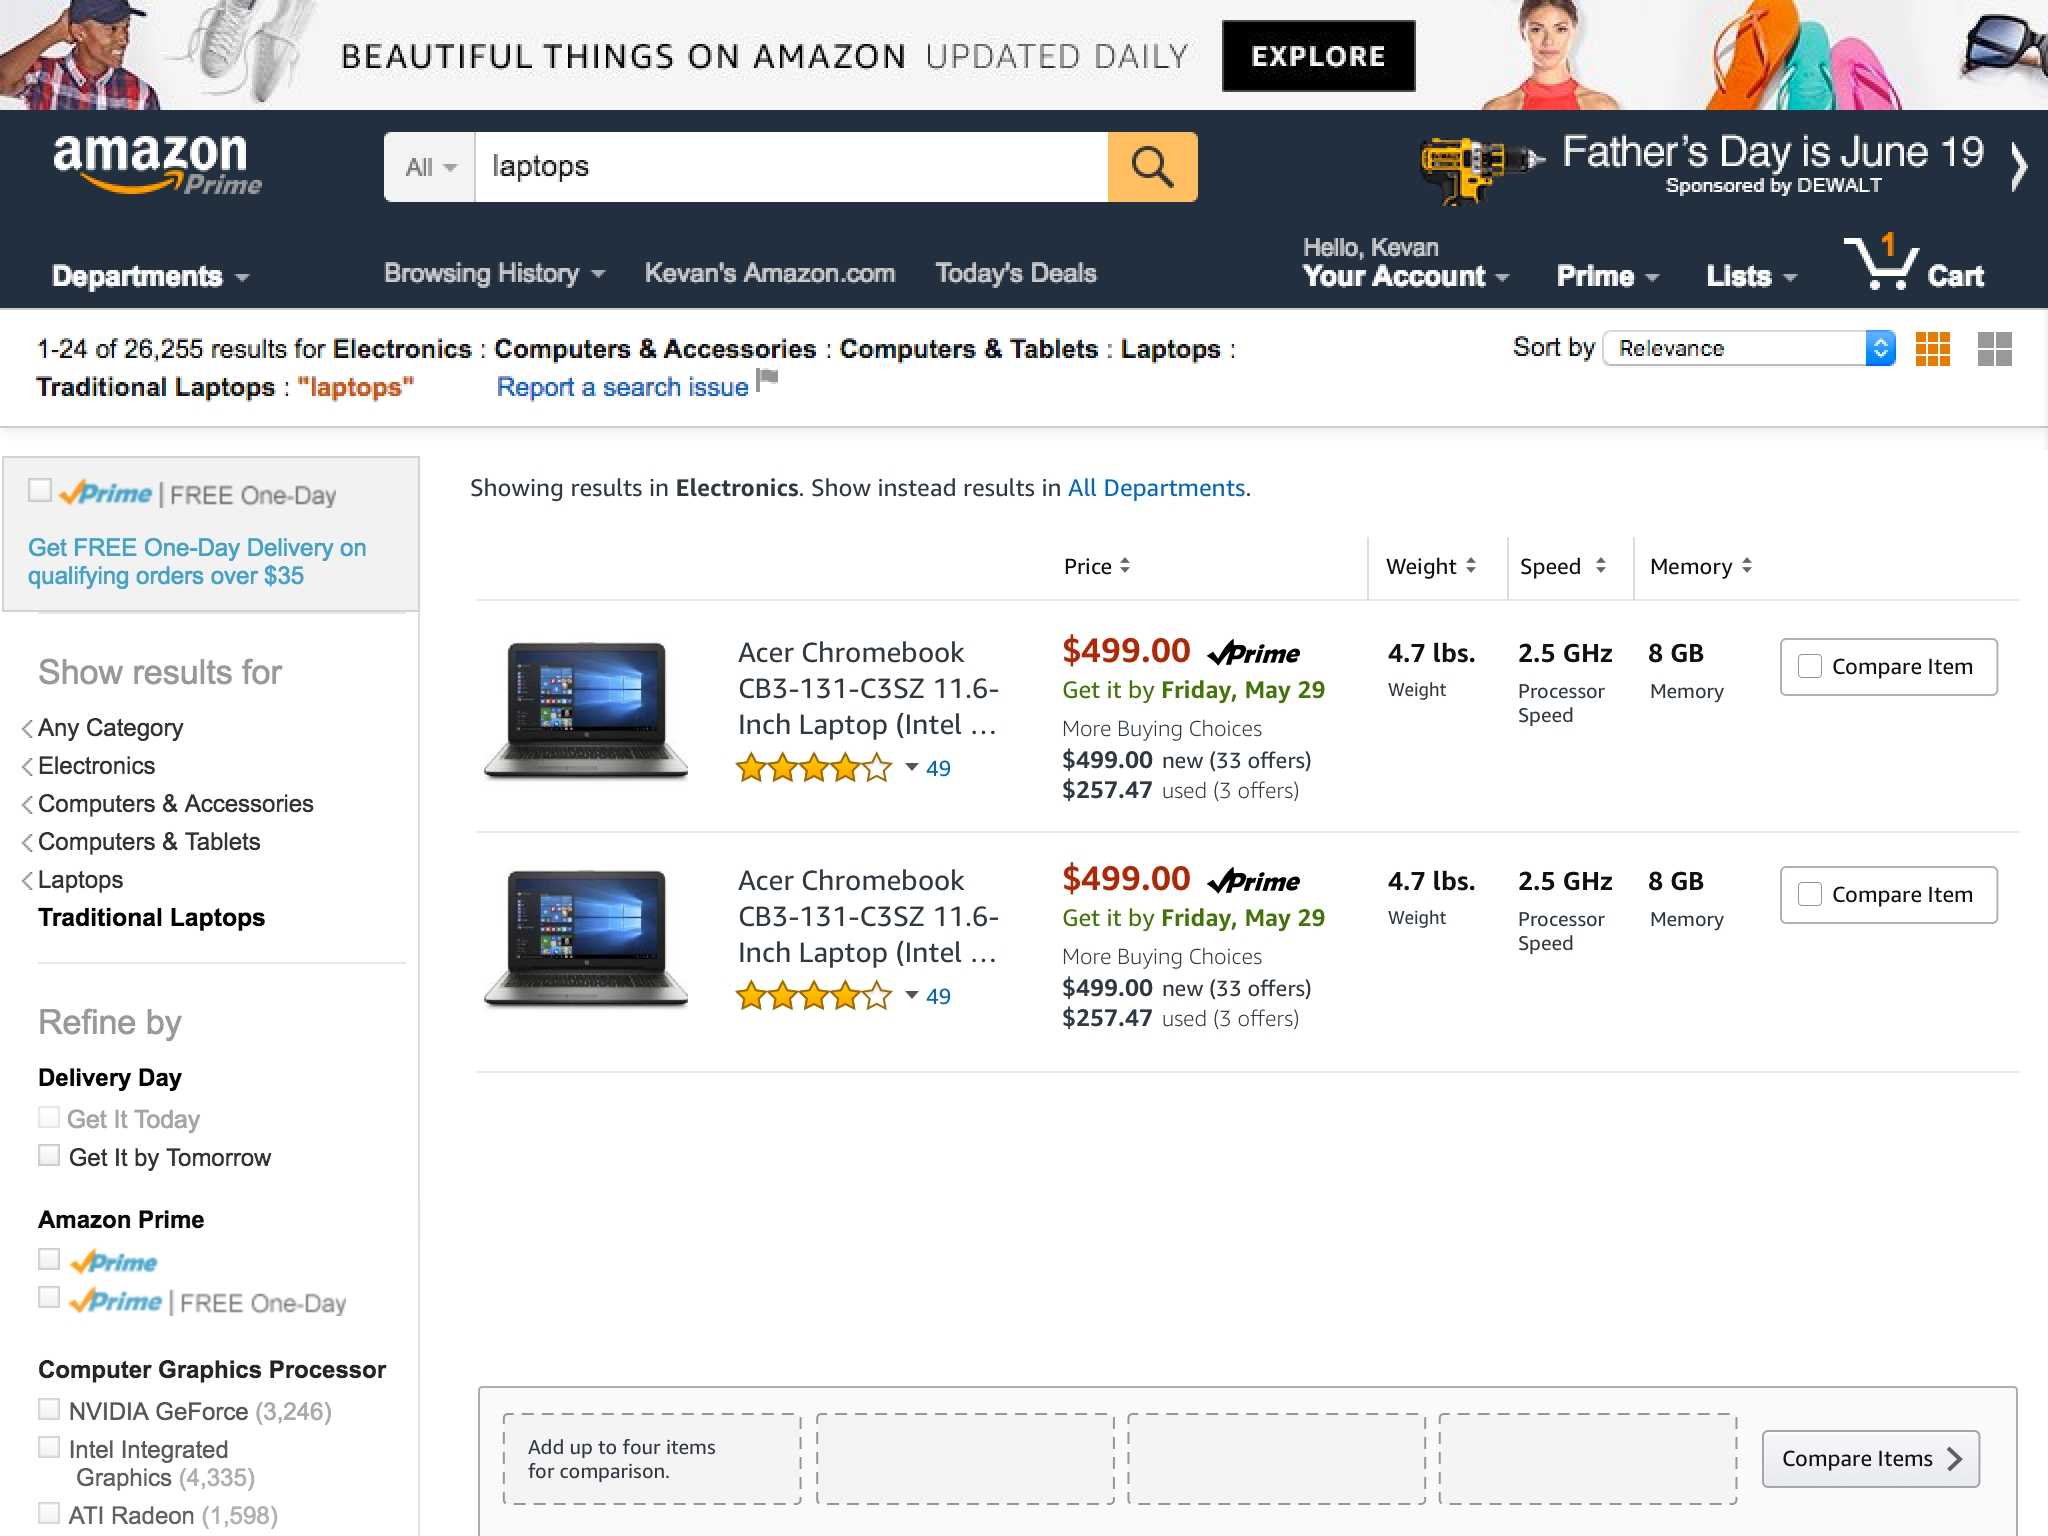
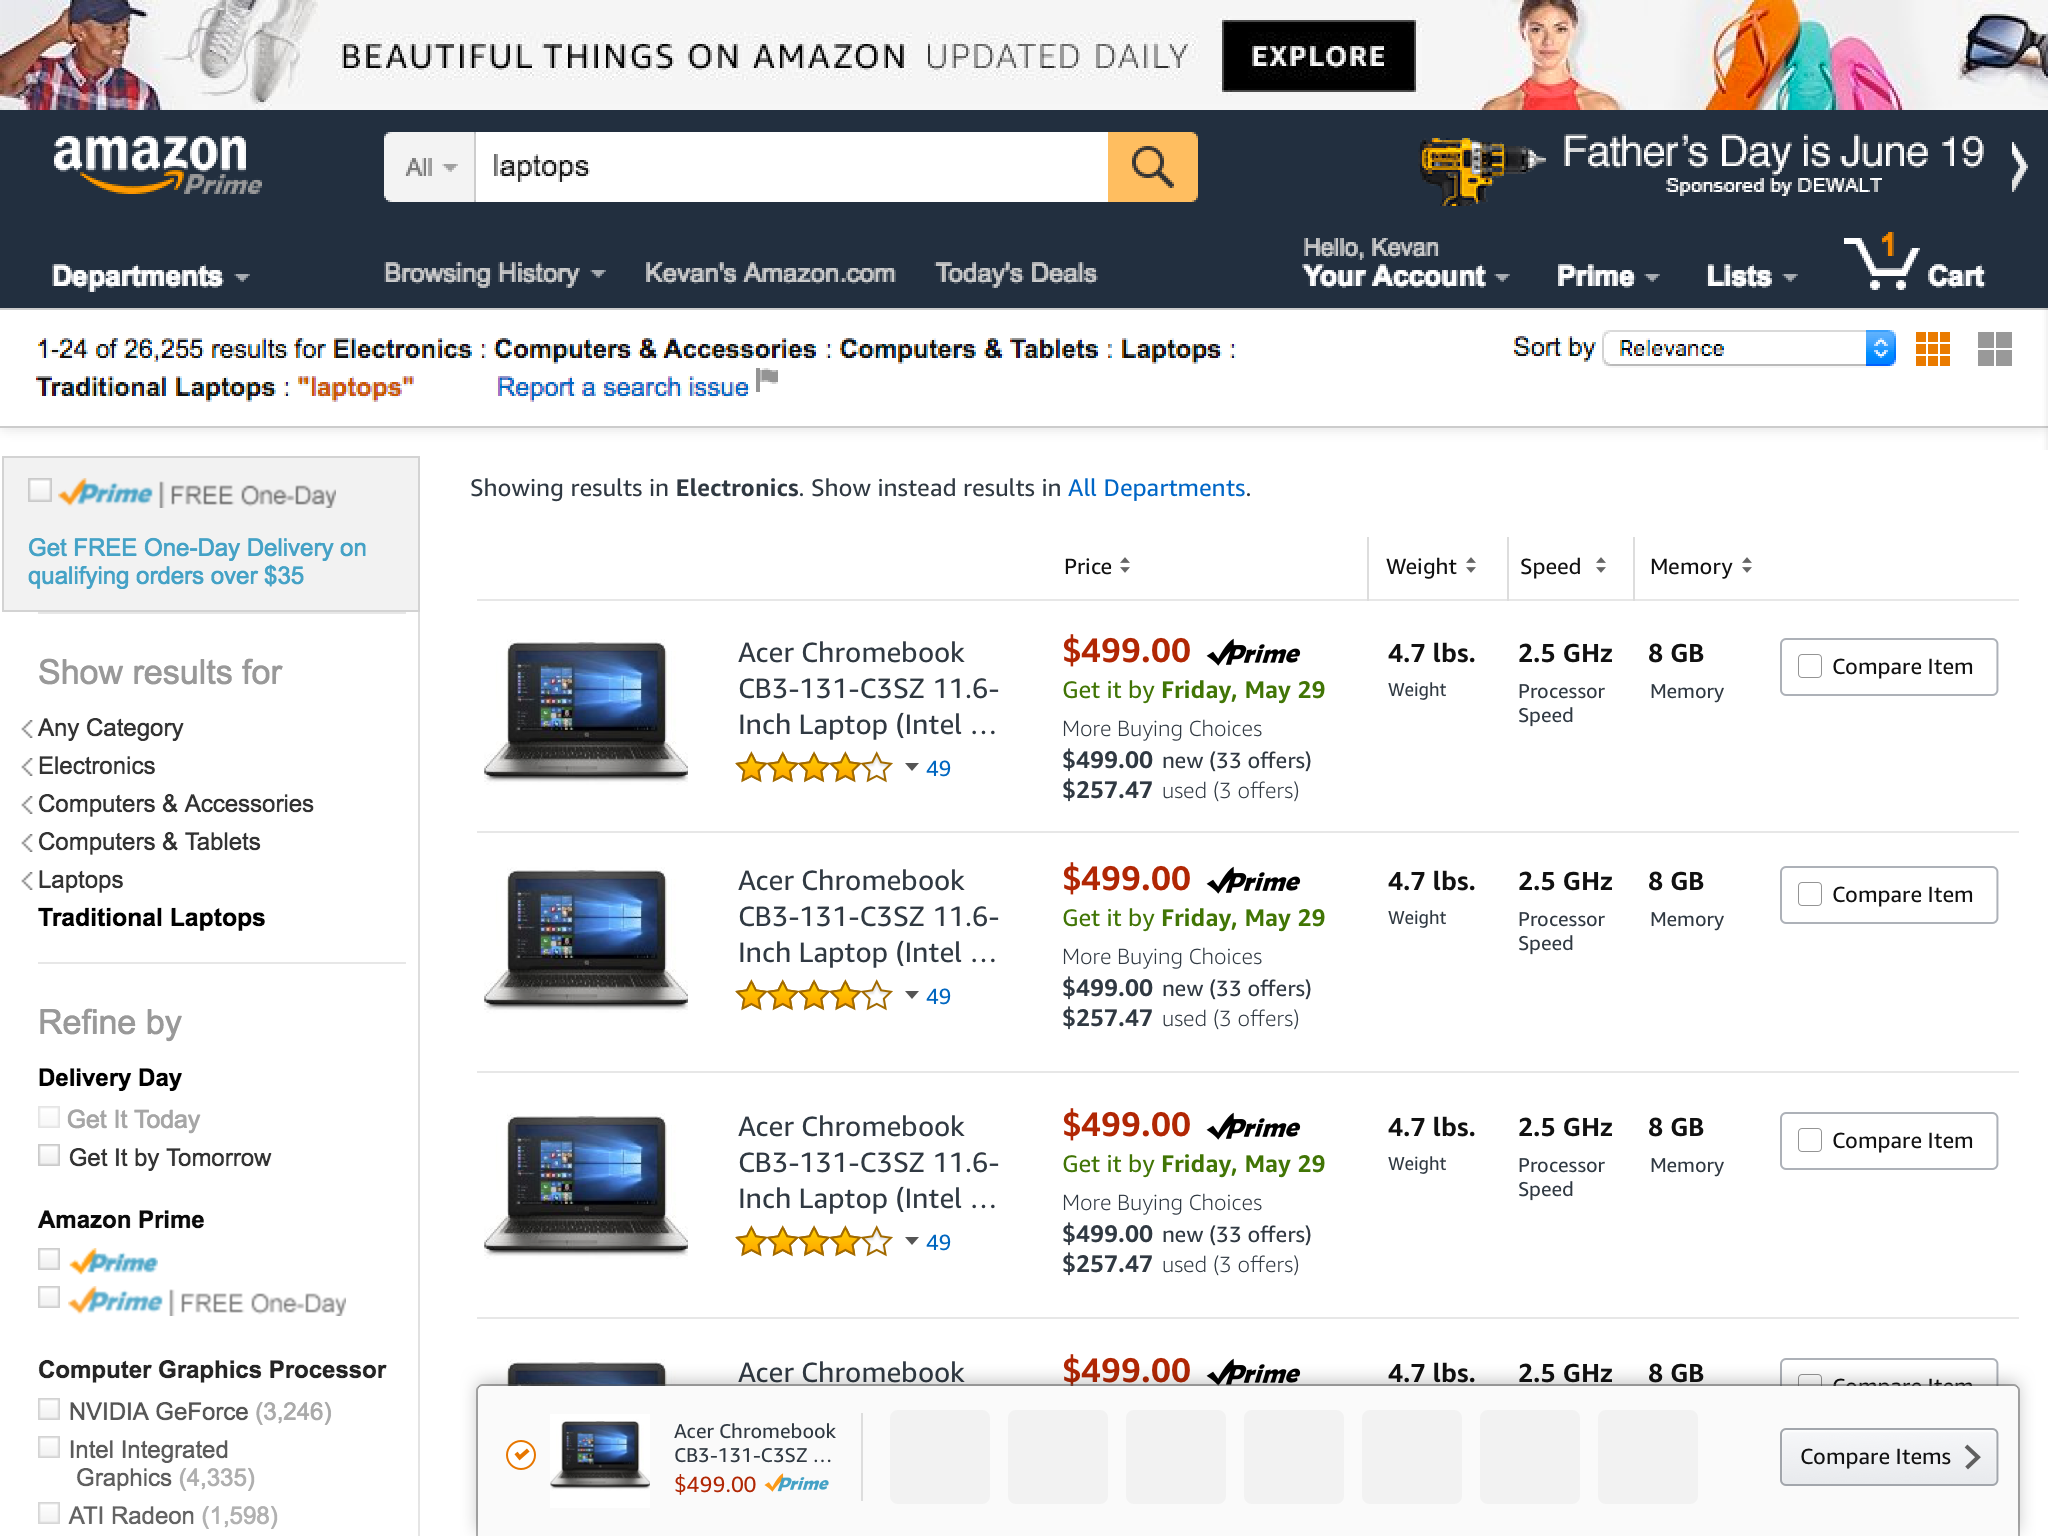
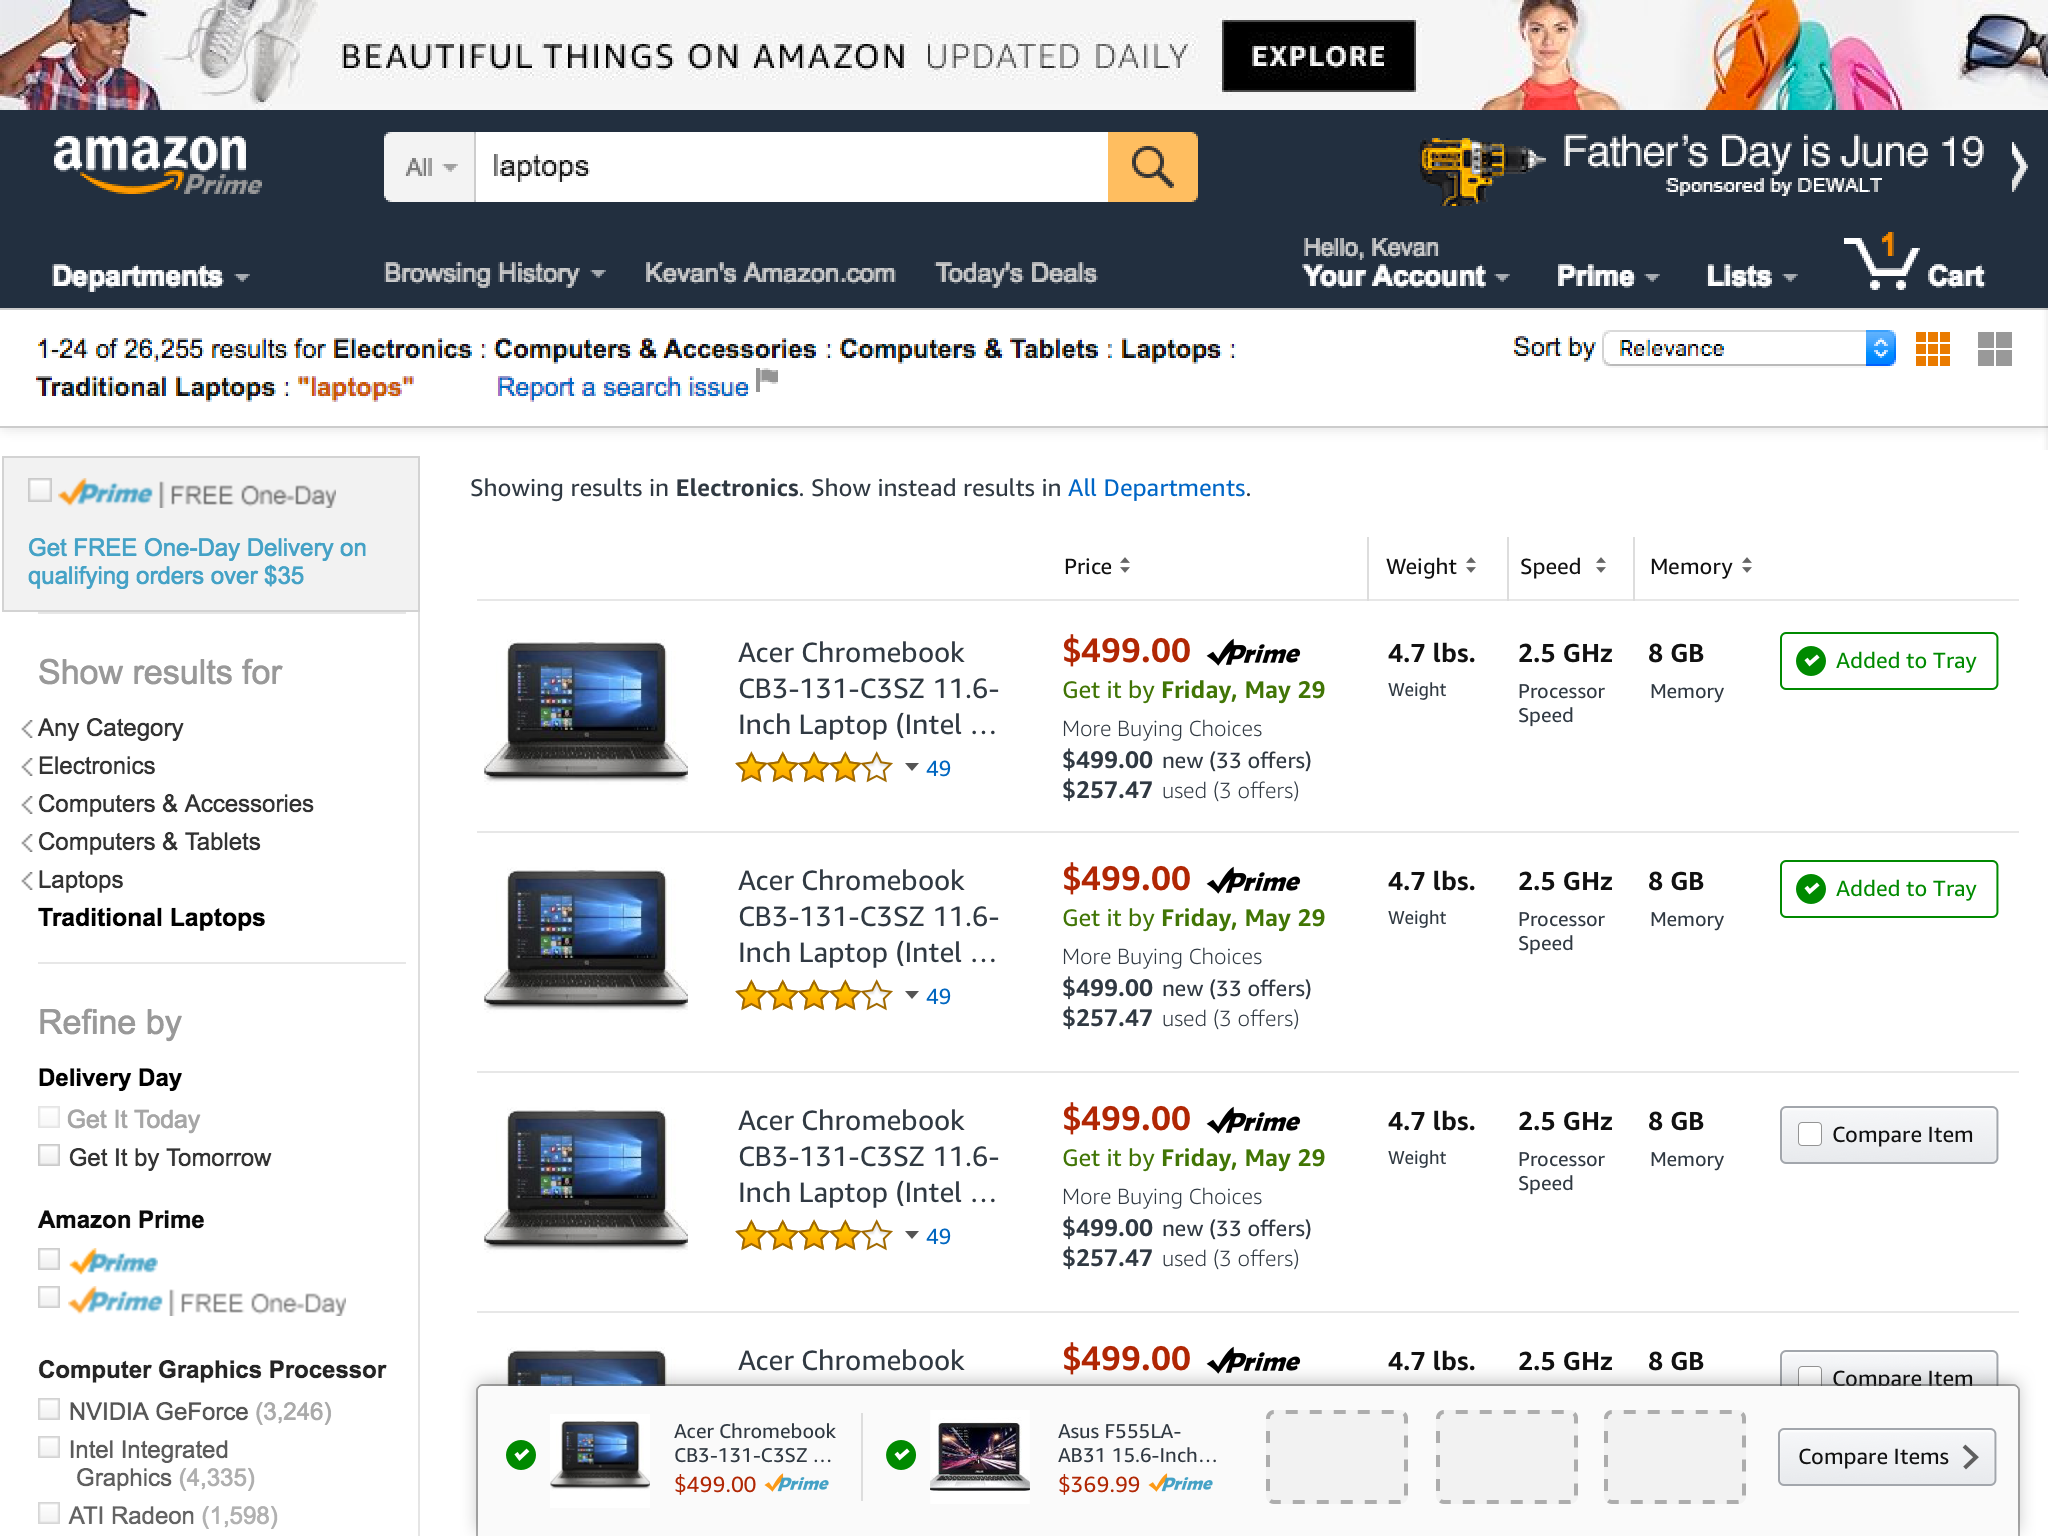
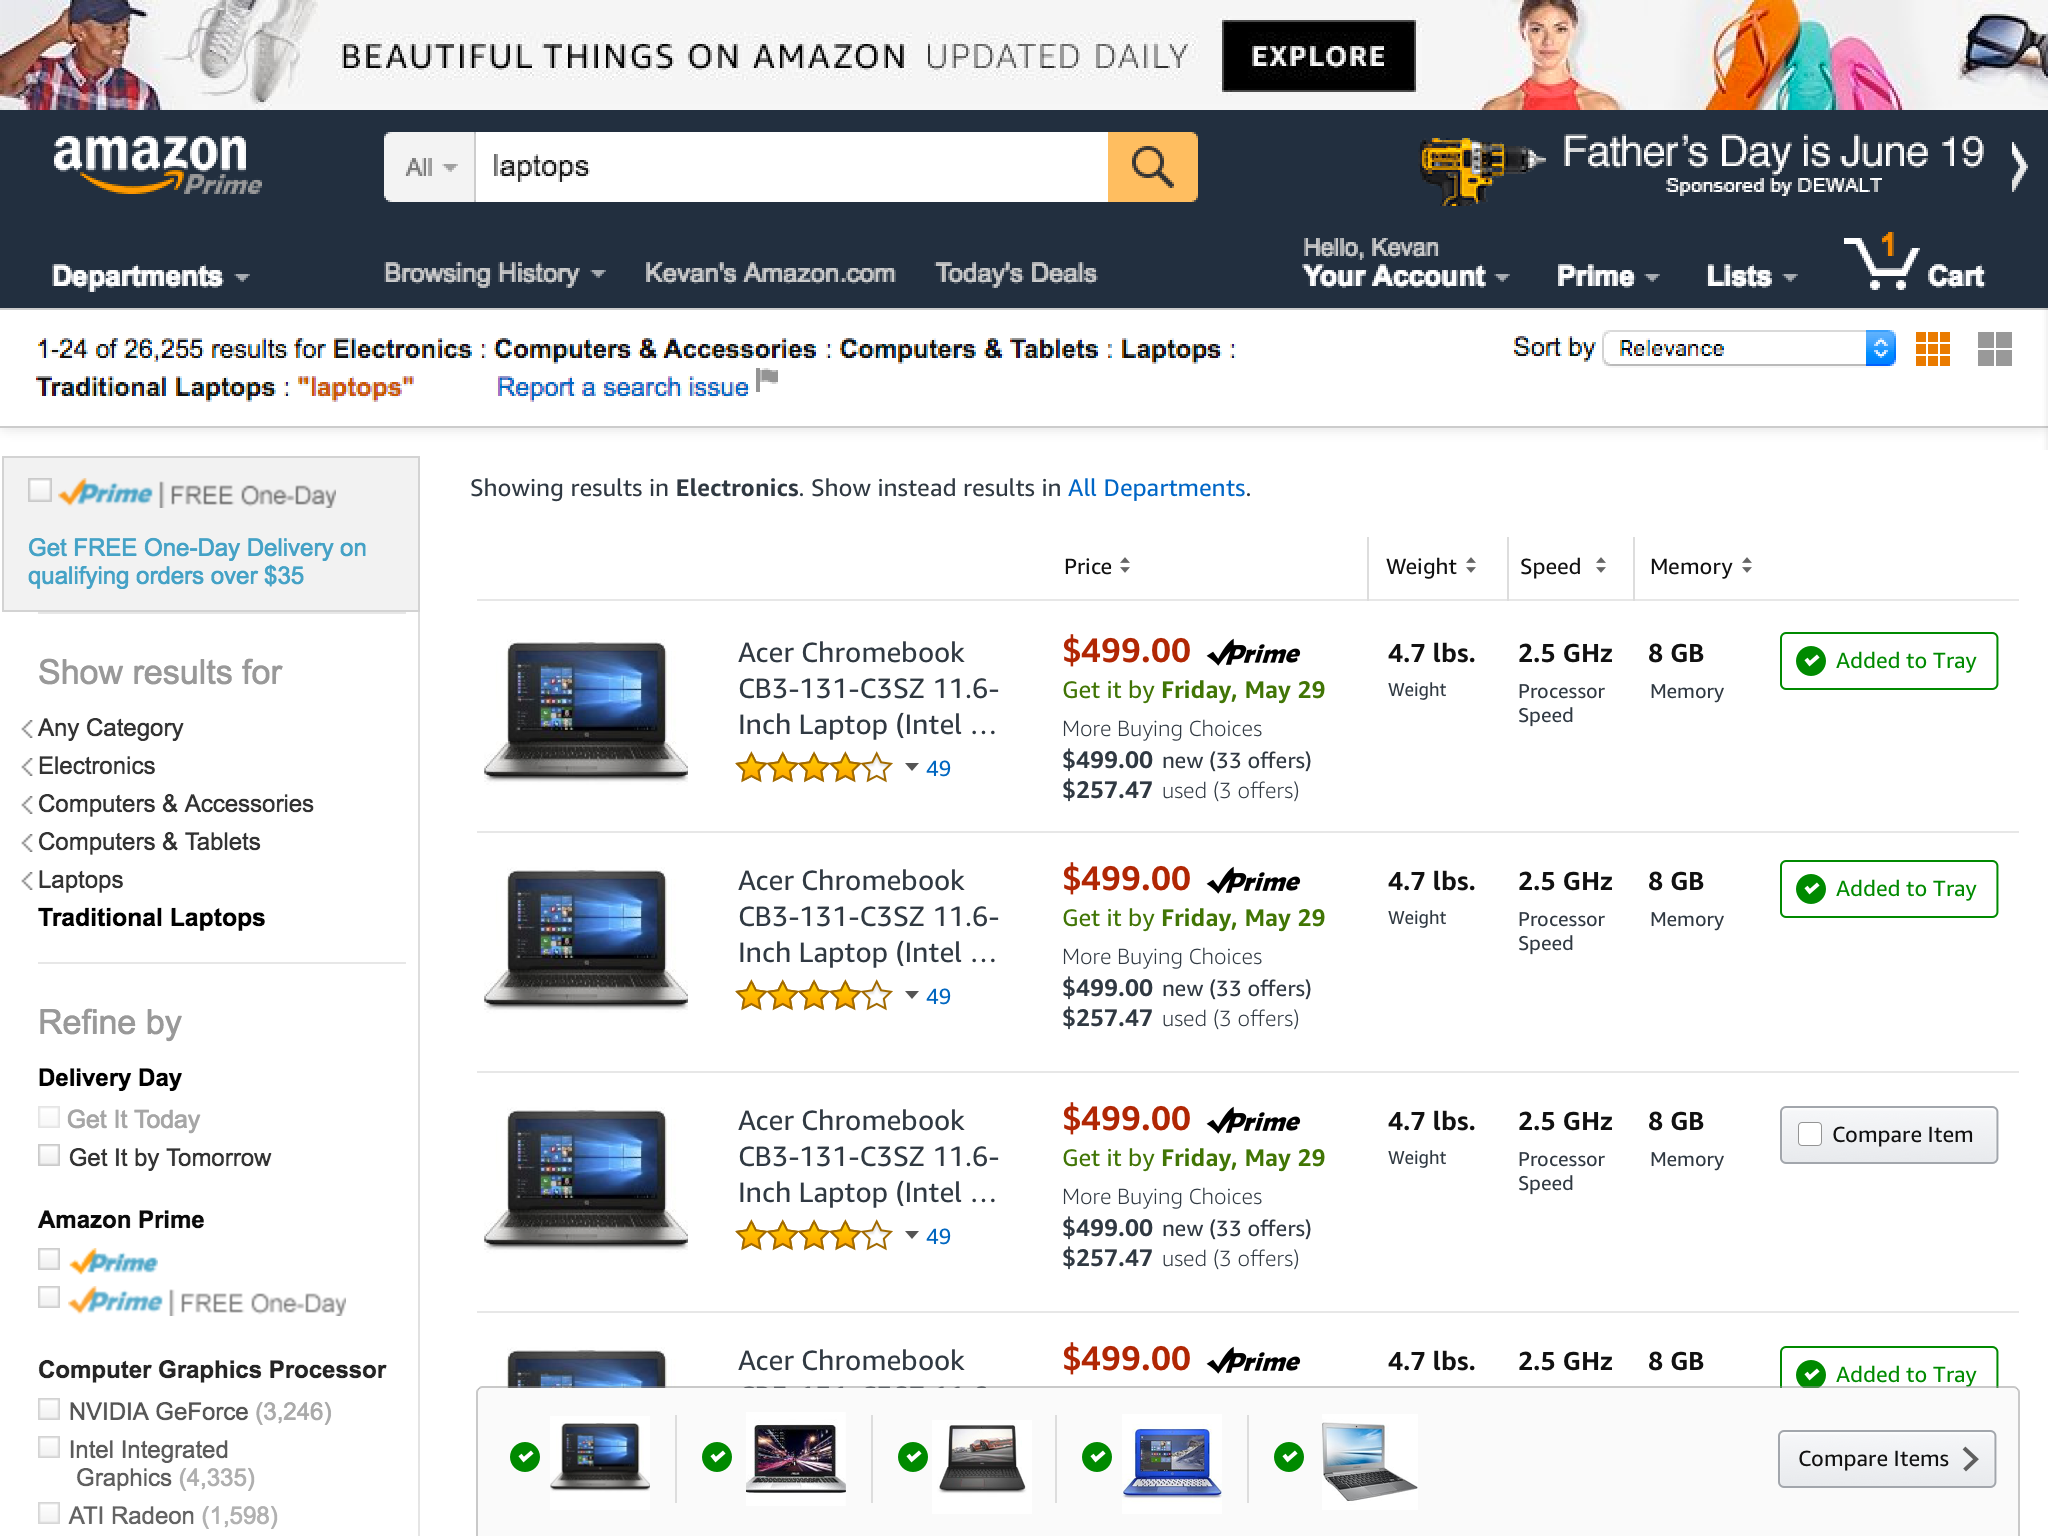
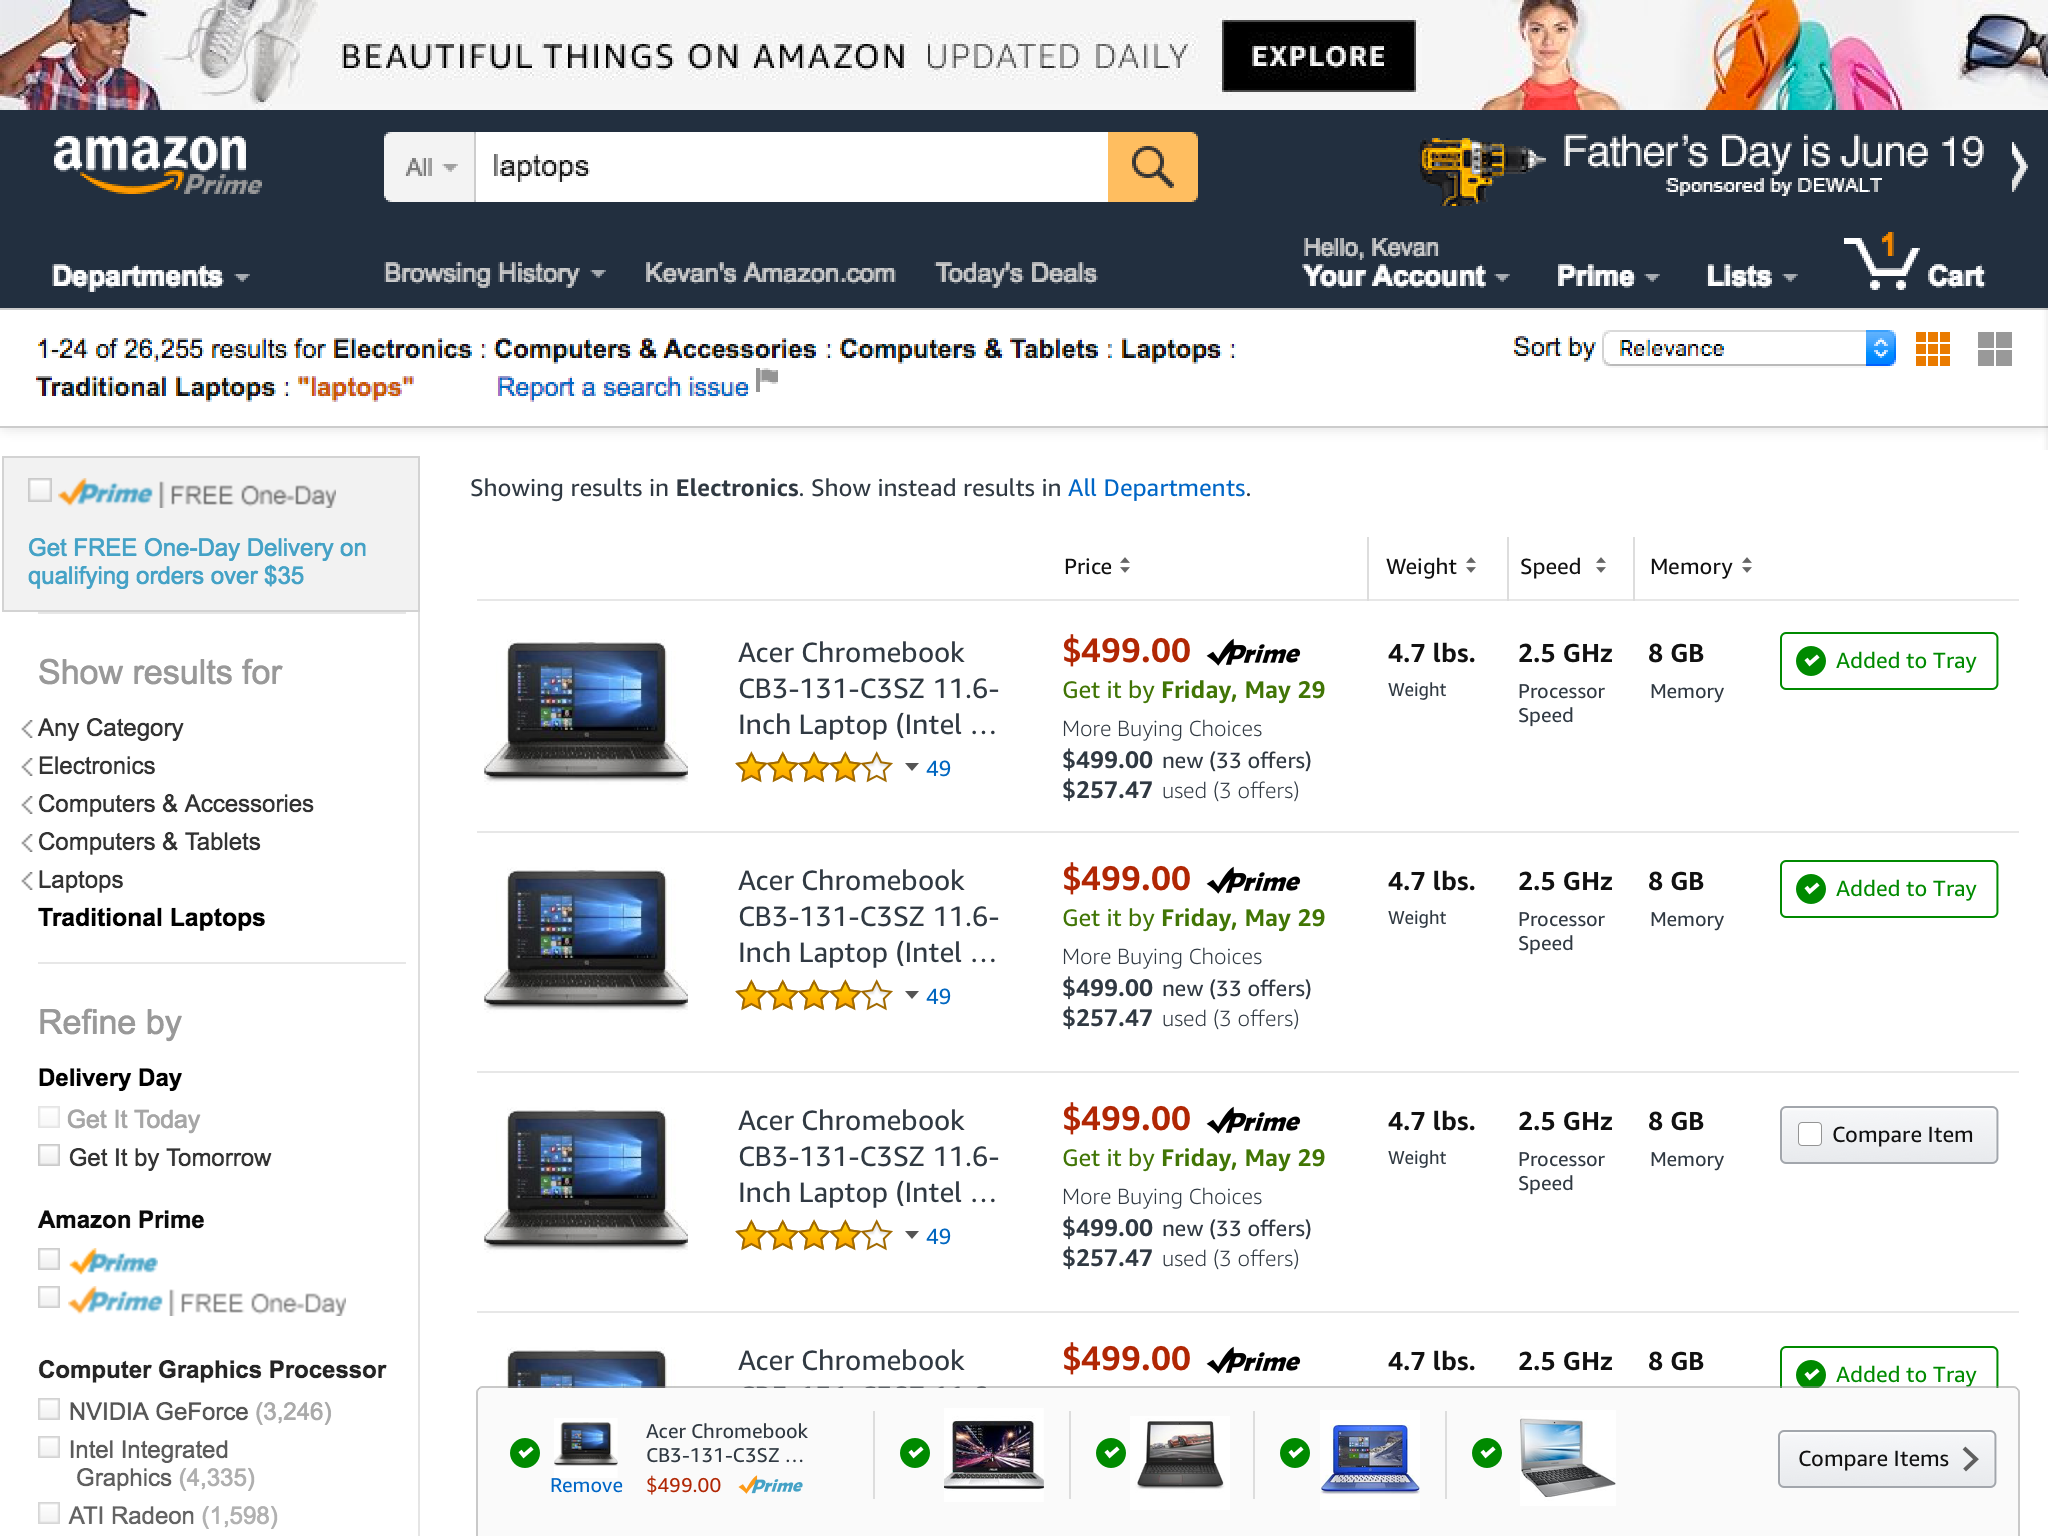
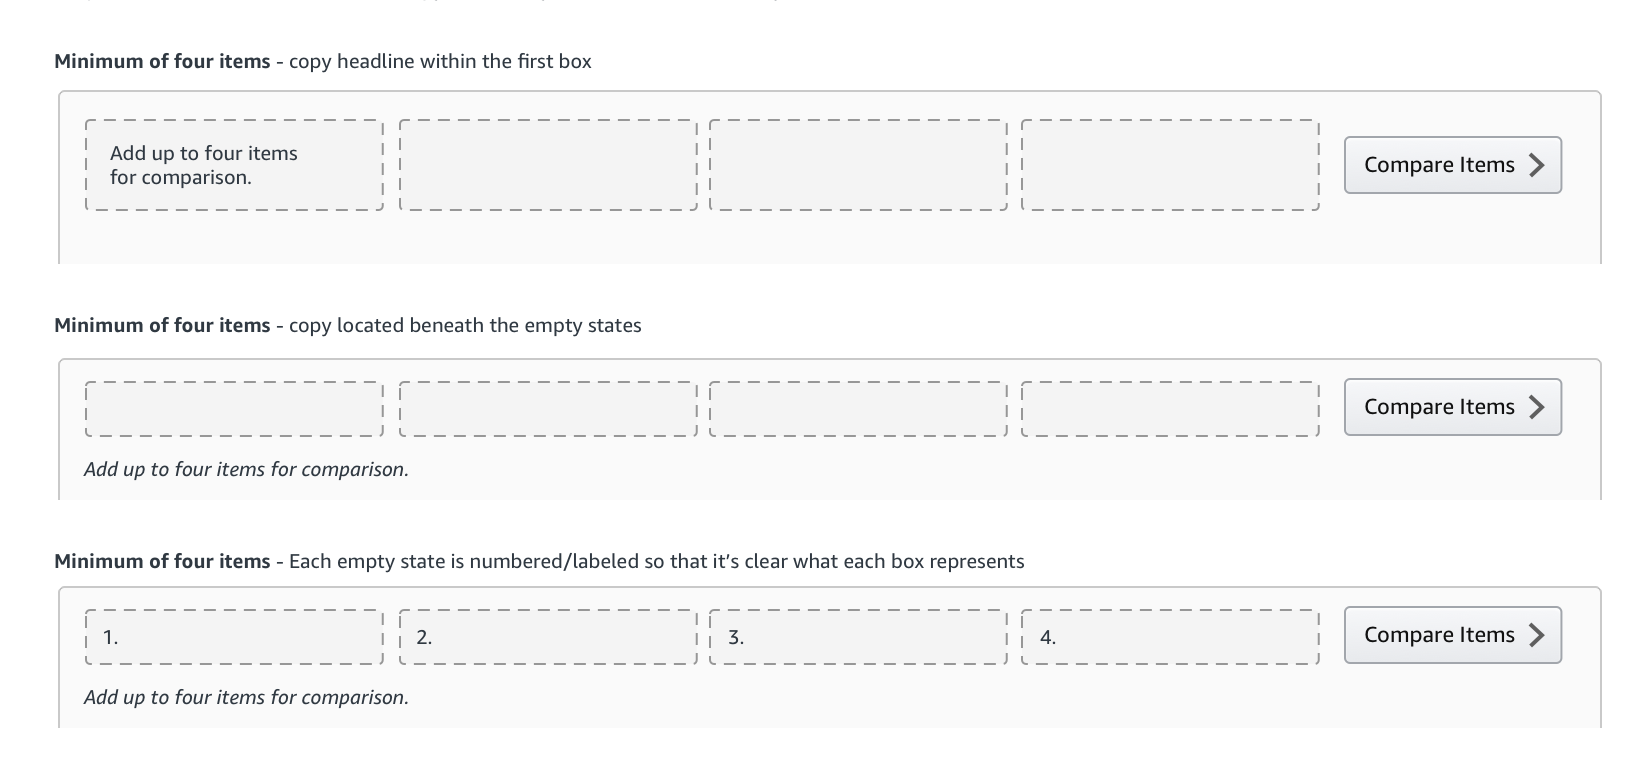
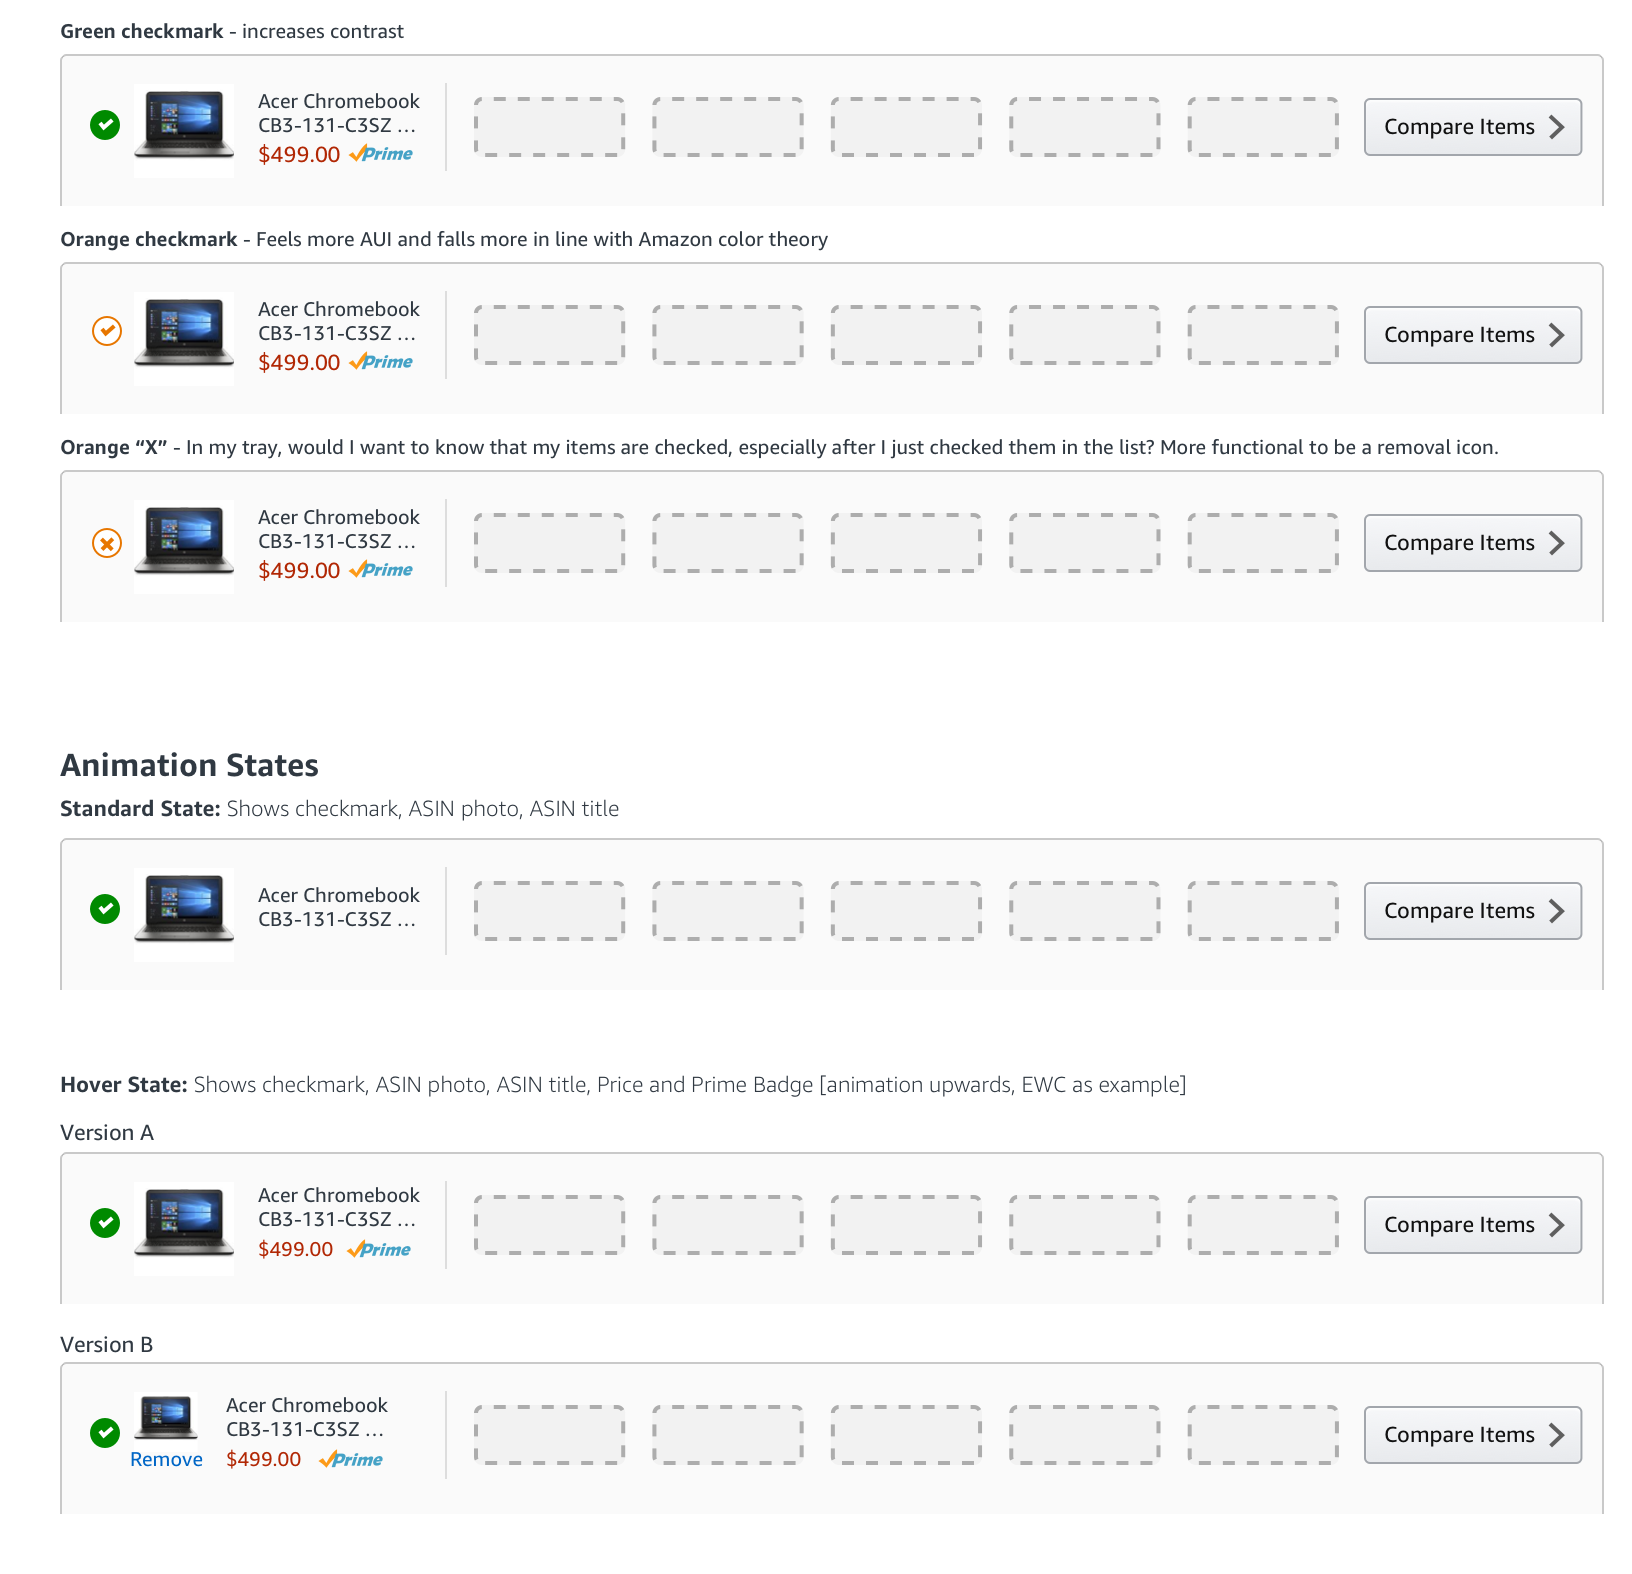
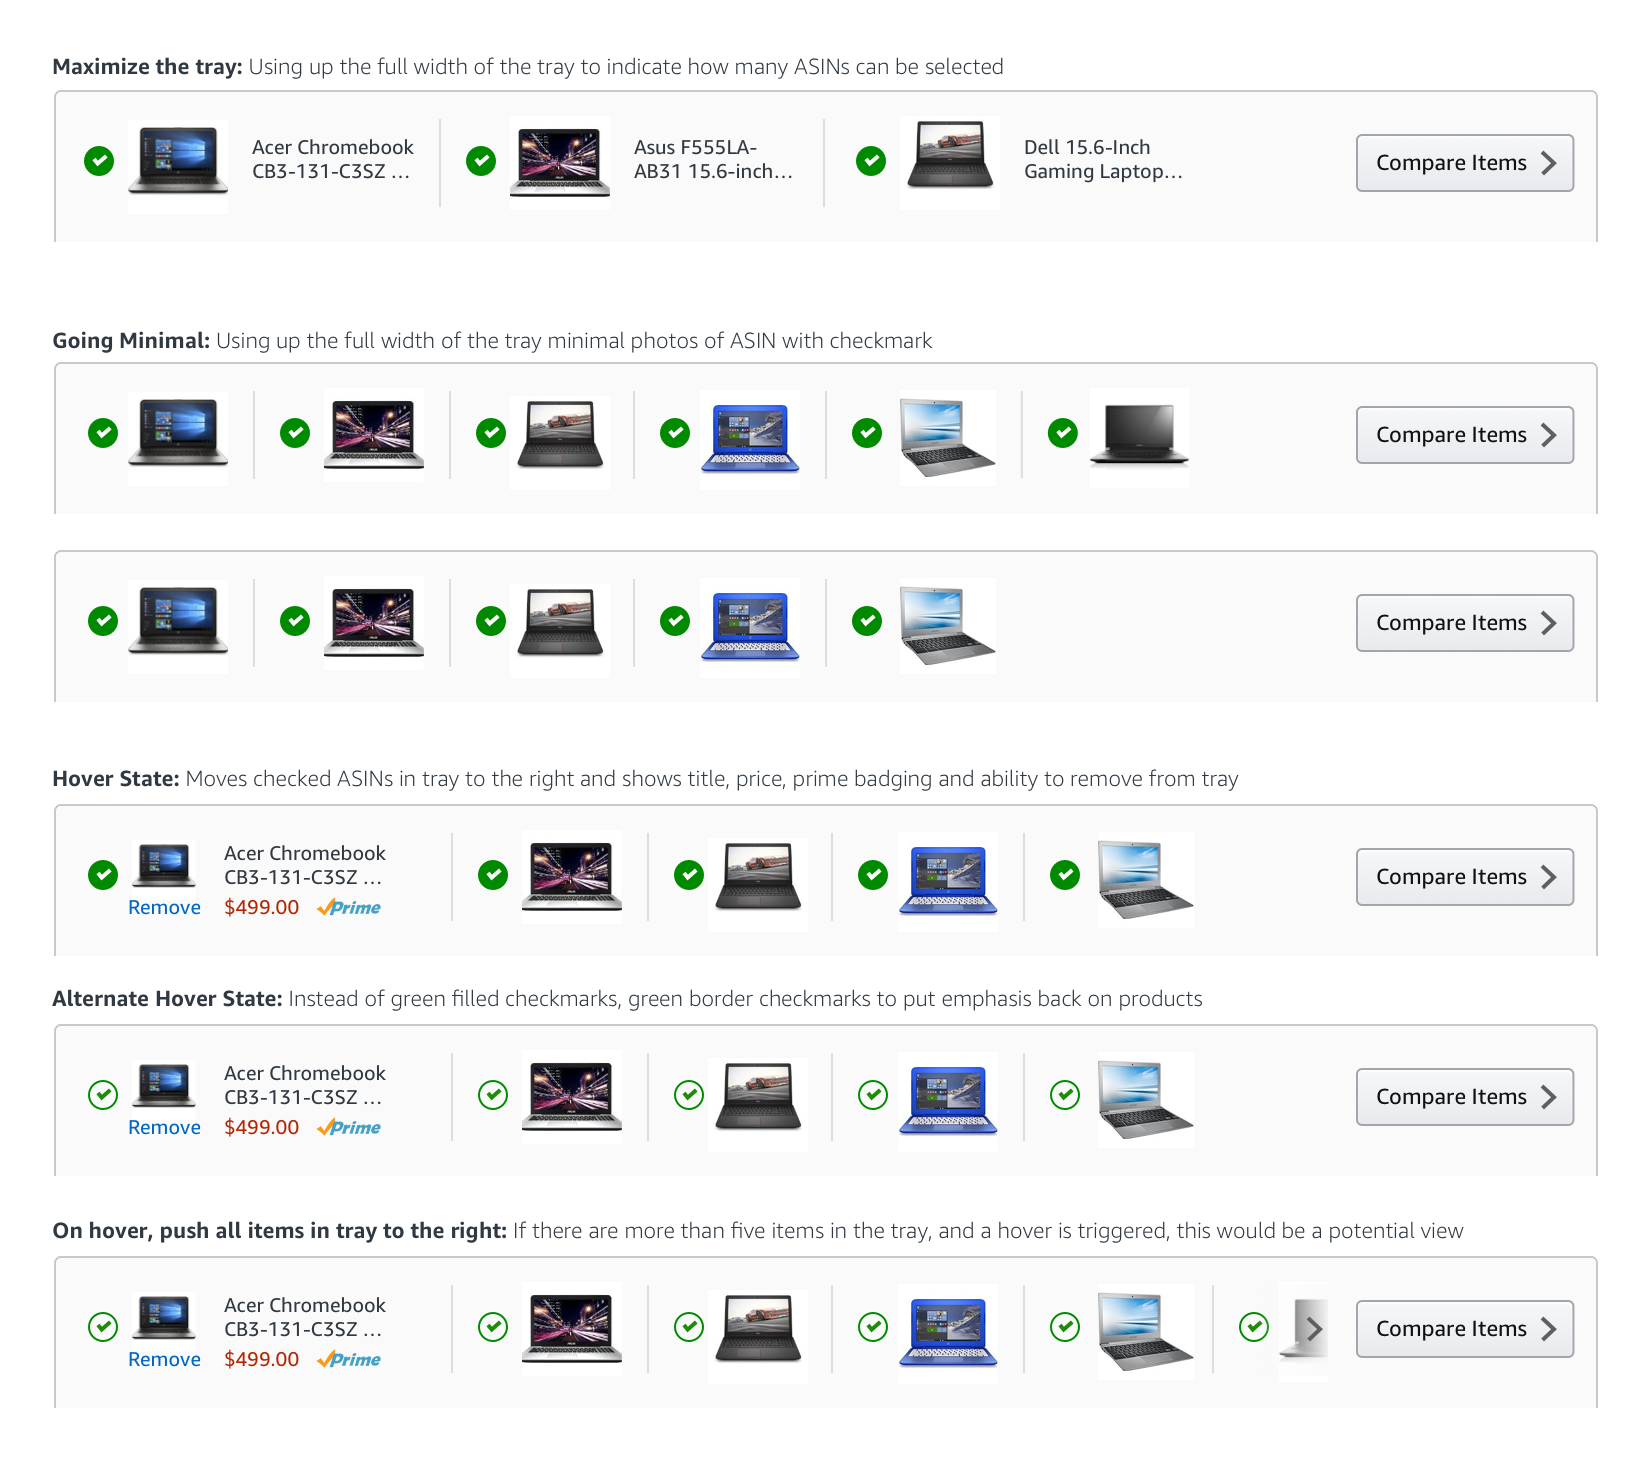
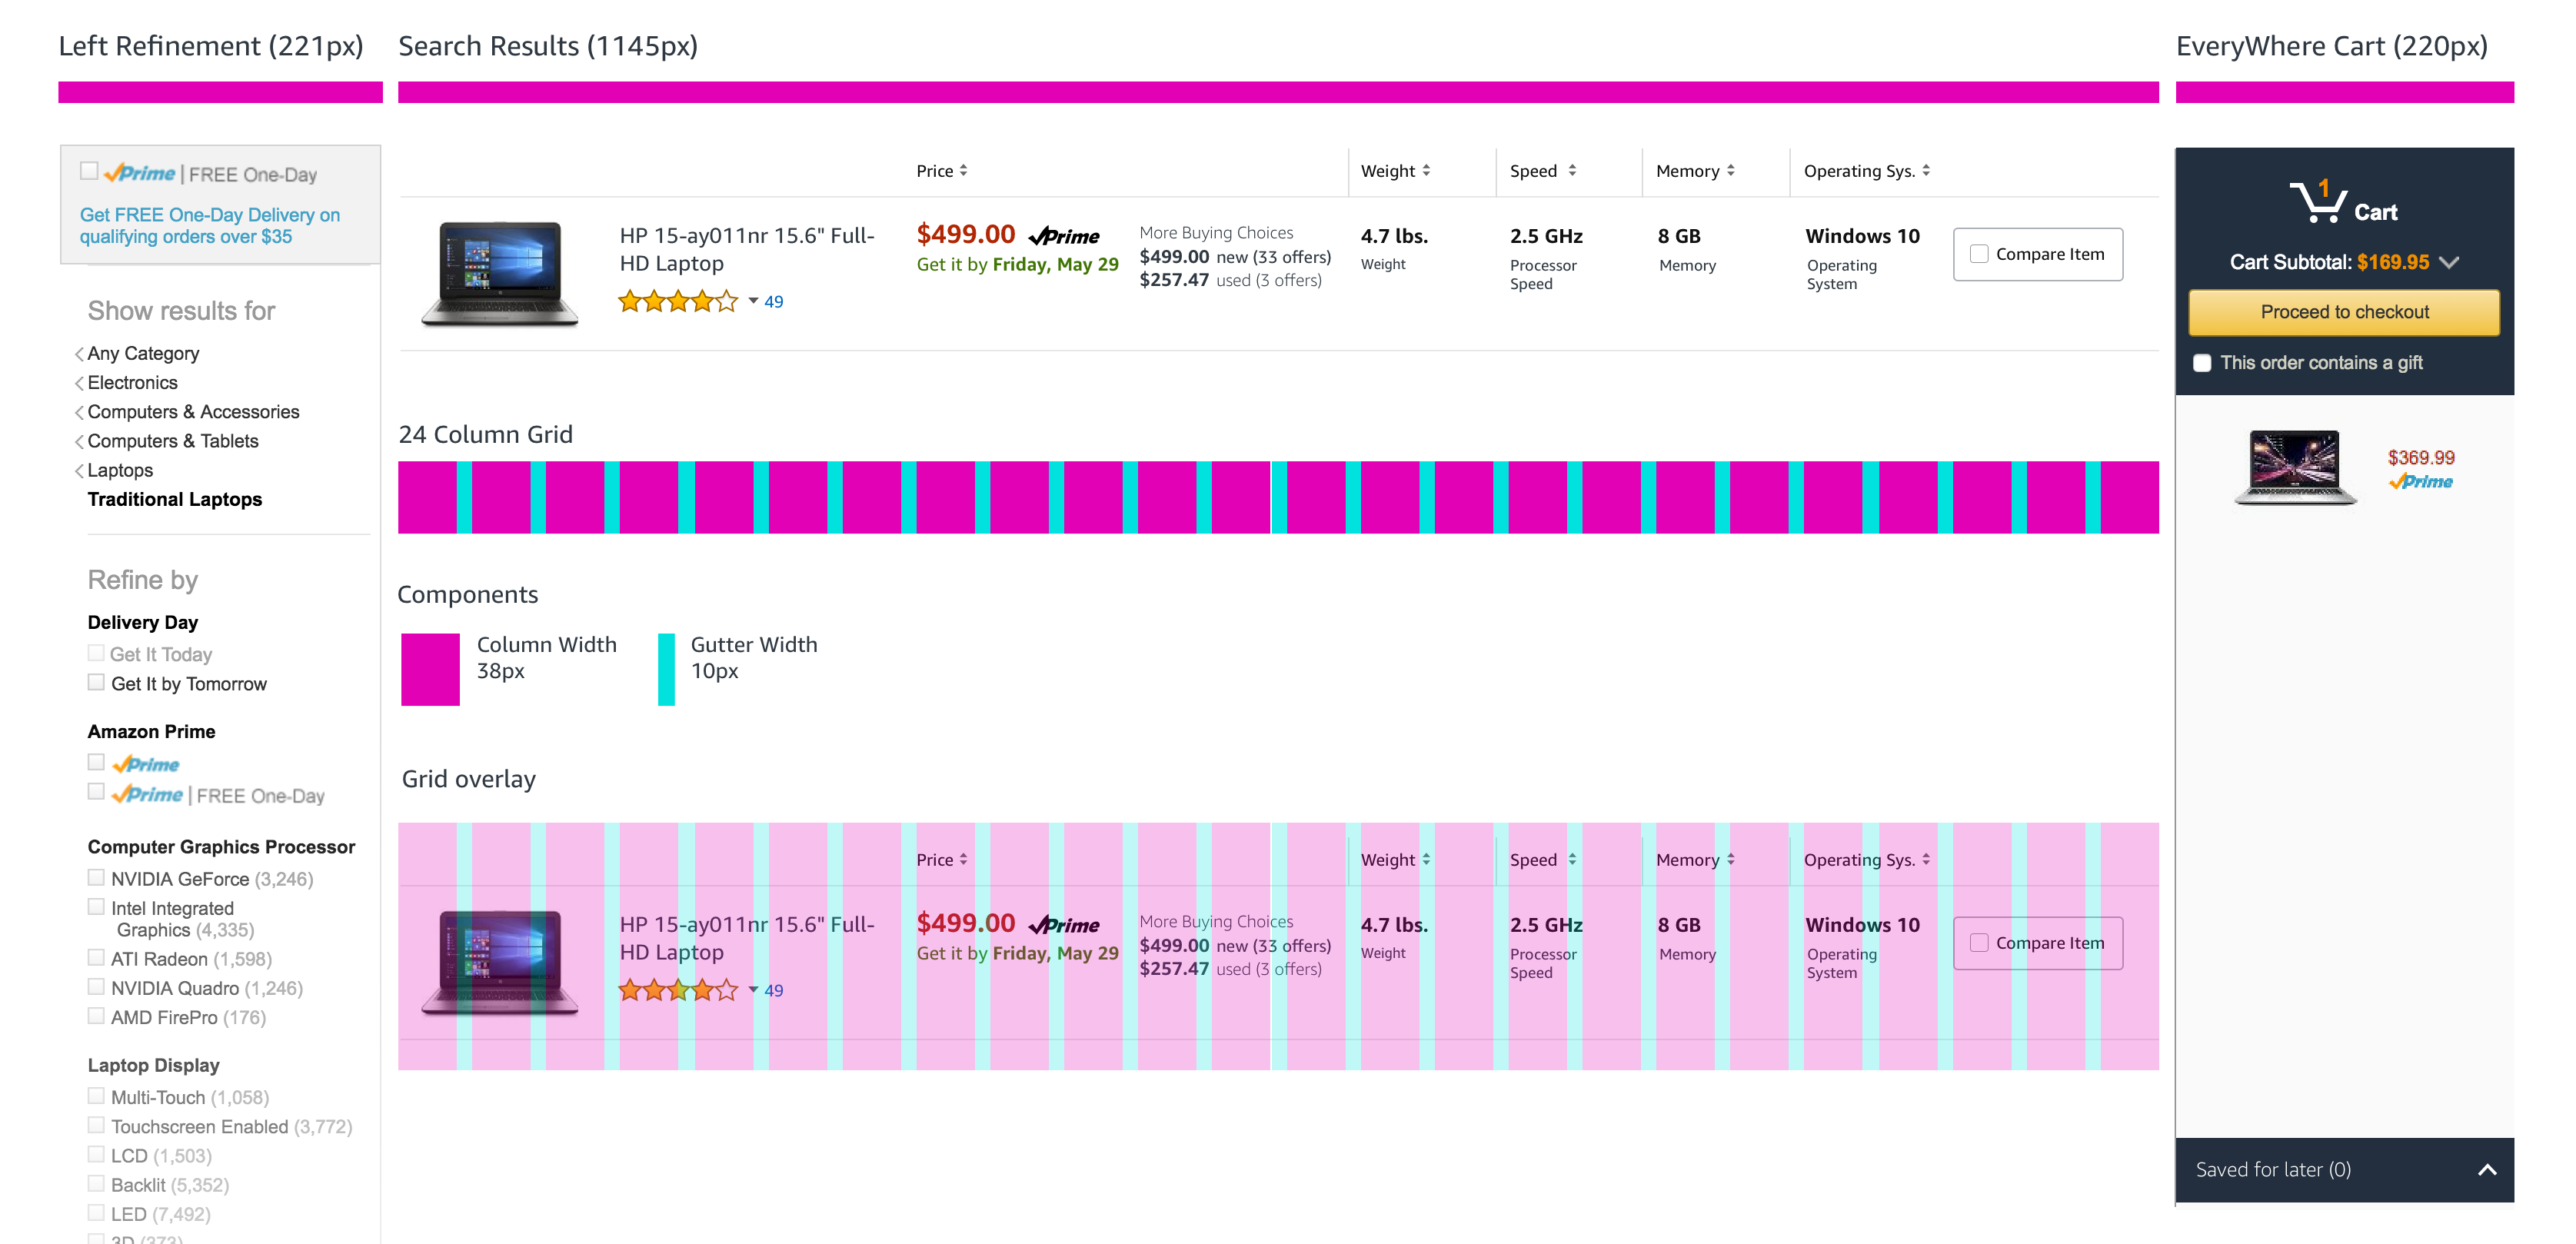
With the tray at a point where we felt like it was worth exploring, and the product specifications designed with visual clarity, it was time to finesse the design so that it would fit completely within the larger search context of customers. We had to design a harmonious grid for all of this live in.
Deliver
Deliver an experience with confidence
We employed usability testing to provide a degree of confidence when it came to our designs. Again, we focused on mobile and desktop experiences and split cohorts accordingly. In setting up the usability testing, we considered two factors:
- Time to complete a task (compare multiple products)
- Degree of difficulty when attempting to completing task
The final spec
Since we didn't test or benchmark on mobile during initial research, it was difficult to determine the actual decrease in friction, or the change in time on task. All we could do is monitor for sentiment and see if the design was an improvement in that way.
To that end, users reported that although the experience had the potential to be helpful, they weren't going to use their mobile device to do this kind of comparing of products. They preferred to do this kind of activity on desktop instead.

In the desktop version, we saw a dramatic decrease in time to task (compare at least two items to one another). In our proposed designs, we saw this time to be 5 minutes on average
